racing.neoamorfic.aiPowered by QEIv18™
2026 Race Intelligence

Miami 2026

Miami produced a split race-state structure. McLaren led the race-level field layer through Norris and Piastri, while Antonelli retained the strongest Mercedes control signature through the middle sector of the lap.

Executive summary

Miami separates full-race structural performance from outcome conversion.

McLaren structural statement
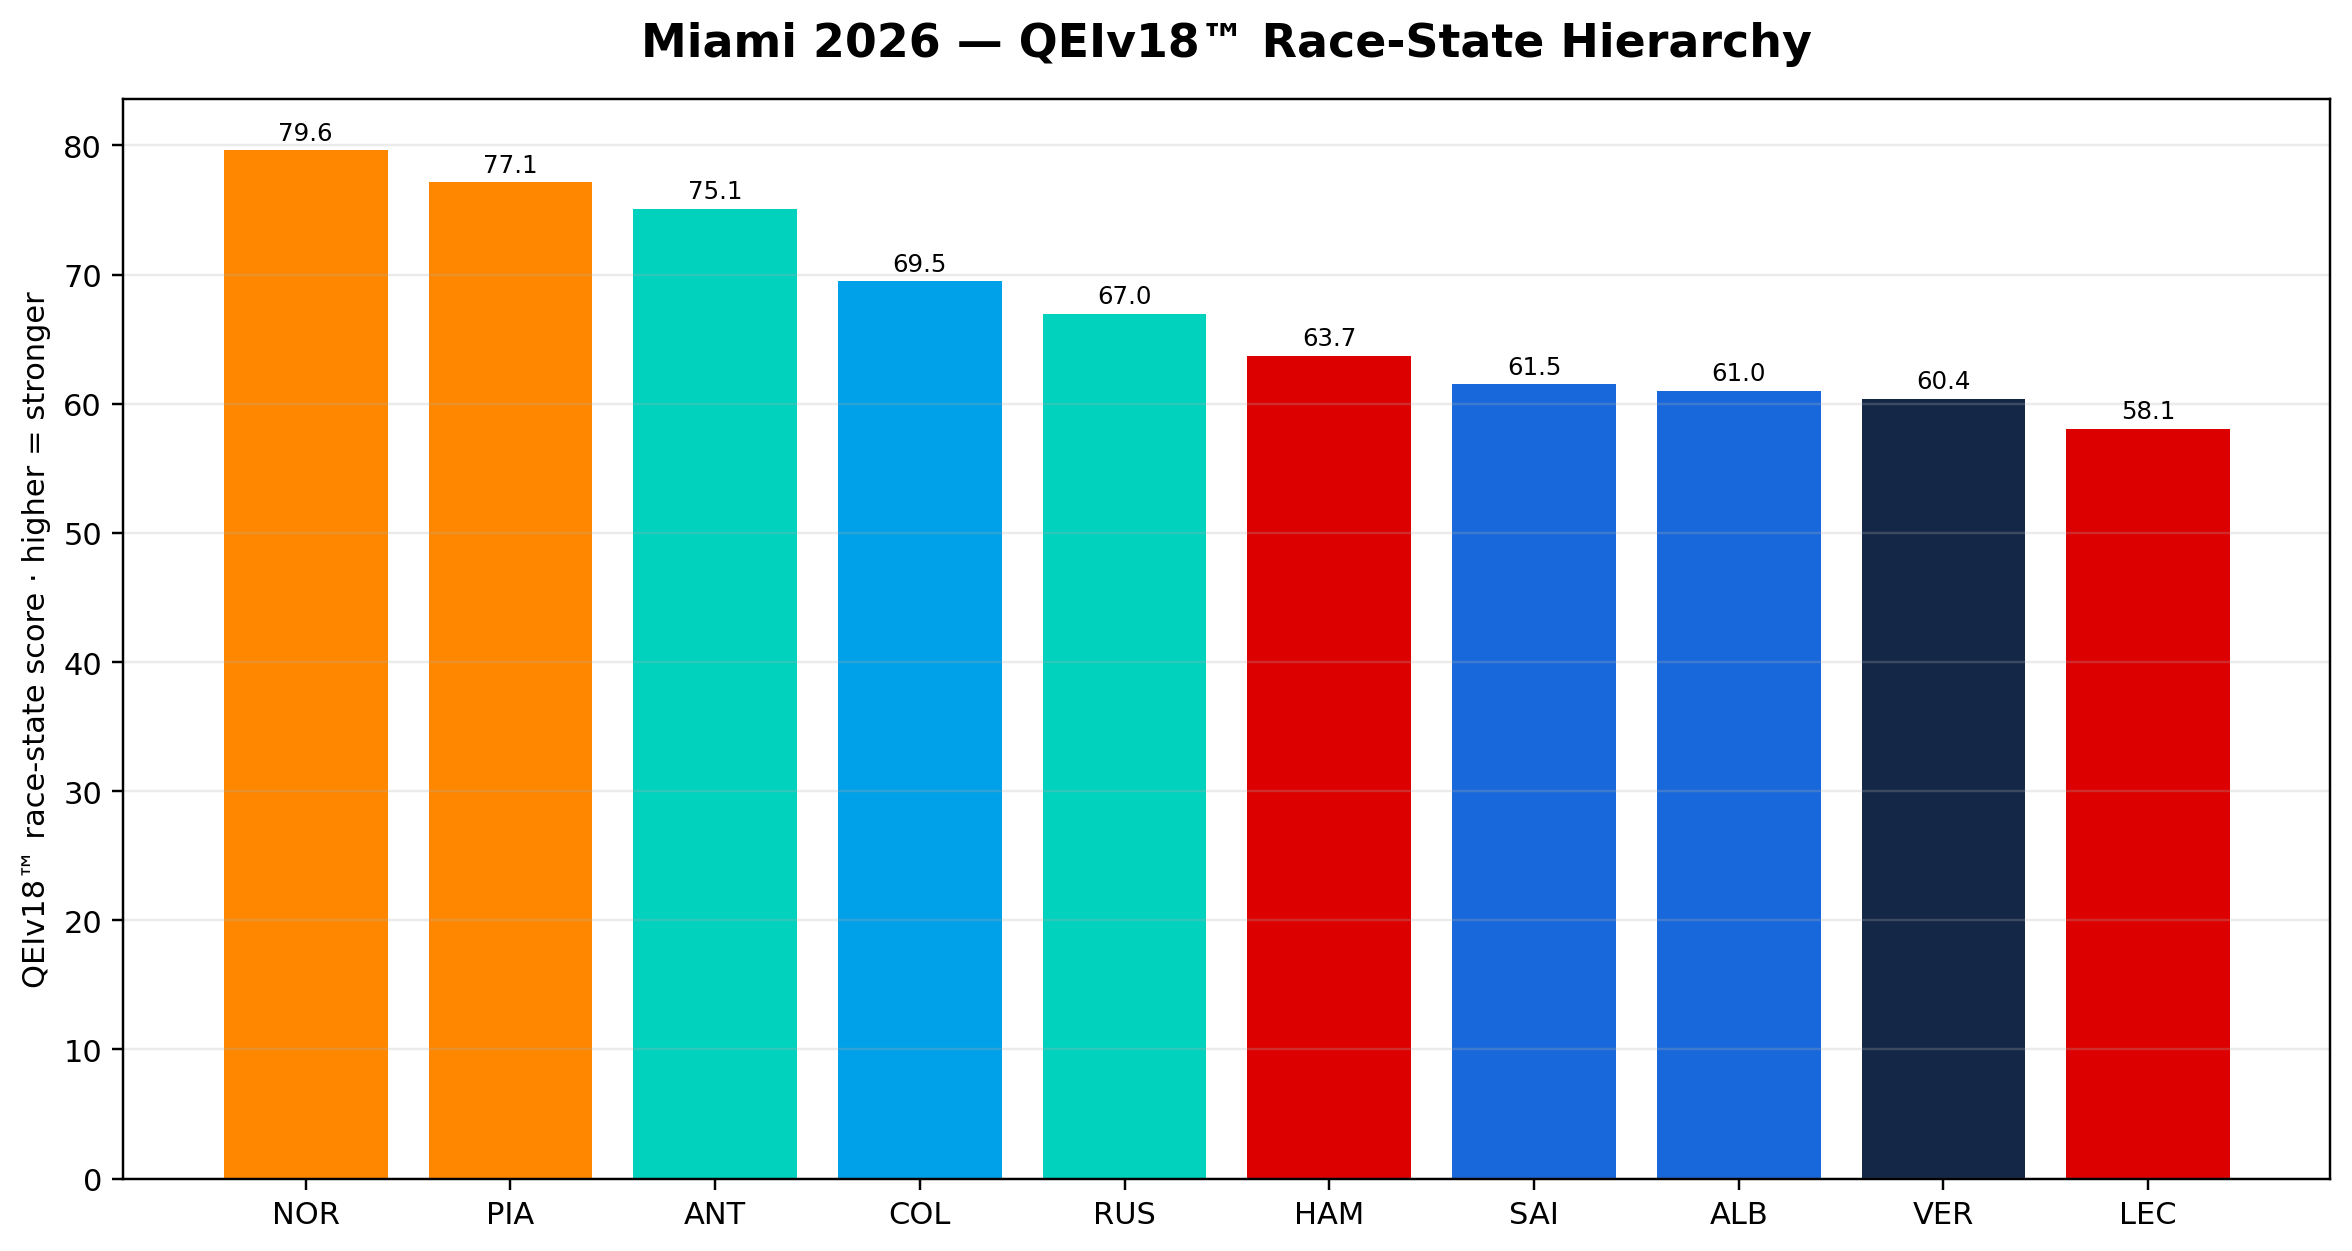
Norris leads the Miami QEIv18™ race-state table at 79.63 and Piastri ranks second at 77.13. Miami is the first 2026 event where McLaren places first and second in the structural race index.
Antonelli conversion win
Antonelli ranks third structurally at 75.10, but converts the visible race outcome through execution, position, and the strongest S2 control phase of the event.
Championship implication
Antonelli still leads the QEIv18™ Championship, but Norris and McLaren now show a serious structural case for upper World Championship positions.

QEIv18™ race-state hierarchy

Norris leads the Miami race-state index, Piastri confirms McLaren depth, and Antonelli remains the strongest Mercedes structural reference.

Miami 2026 — QEIv18™ race-state table
QEIv18™ race score is a bounded comparative index of realised race state. It combines field-relative control, repeatability, peak capability, and competitive ordering. Higher score means stronger structural race performance; it is not F1 points and not finishing classification.
RankDriverTeamQEIv18™ scoreAvg field orderingPeak field ordering
1NORMcLaren79.633.261
2PIAMcLaren77.135.001
3ANTMercedes75.103.531
4COLAlpine69.497.582
5RUSMercedes66.966.391
6HAMFerrari63.737.073
7SAIWilliams61.529.111
8ALBWilliams61.0010.335
9VERRed Bull Racing60.407.331
10LECFerrari58.075.891
Avg field ordering and best ordering are field-relative QEIv18™ ordering metrics. Lower ordering values are stronger.
Outcome conversion vs full-race structure
Miami separates the visible race result from the underlying structural race state. Norris carries the marginally stronger full-race QEIv18™ profile, while Antonelli converts the visible result through execution, position, and his strongest local control phase in S2.
MeasureNorrisAntonelliReading
Miami QEIv18™ race score79.6375.10Norris leads the full-race structural table.
Mean field advantage0.8710.843Norris holds the marginally stronger full-race field layer.
Mean competitive ordering3.263.53Lower is stronger; Norris is slightly stronger on average ordering.
Laps ahead by field advantage2928The structural split is nearly even, not one-sided.
Laps ahead by competitive ordering2928Ordering confirms the same marginal Norris edge.
Pit sequenceLap 27 · 22.565s laneLap 26 · 22.128s laneAntonelli gains outcome-conversion leverage through execution and position.
The conclusion is precise: Norris was the stronger full-race structural performer, while Antonelli converted the race outcome. QEIv18™ makes that separation visible.
Championship signal — Norris and McLaren
Miami is the first race this season where McLaren places first and second in the QEIv18™ race-state hierarchy. Norris leads the event at 79.63, Piastri follows at 77.13, and Antonelli ranks third at 75.10. That is not a minor event signal; it is a team-level structural statement.
After Miami, Antonelli still leads the QEIv18™ Championship table, but Norris and McLaren now have a clear structural case as serious contenders for the upper World Championship positions. The important signal is not one isolated race result. It is the combination of Norris leading Miami, Piastri confirming McLaren depth, and McLaren showing strength across both full-race and sector layers.
QEIv18™ Race-State Hierarchy
Higher score = stronger realised race state
Open PDF
QEIv18™ Race-State Hierarchy
Norris leads the Miami race-state table, with Piastri close behind. Antonelli remains within the top control band but does not reproduce the full-race dominance seen in Japan.

Sector intelligence

Miami separates into McLaren strength in S1/S3 and Antonelli control through S2.

S1 leader
NOR
McLaren
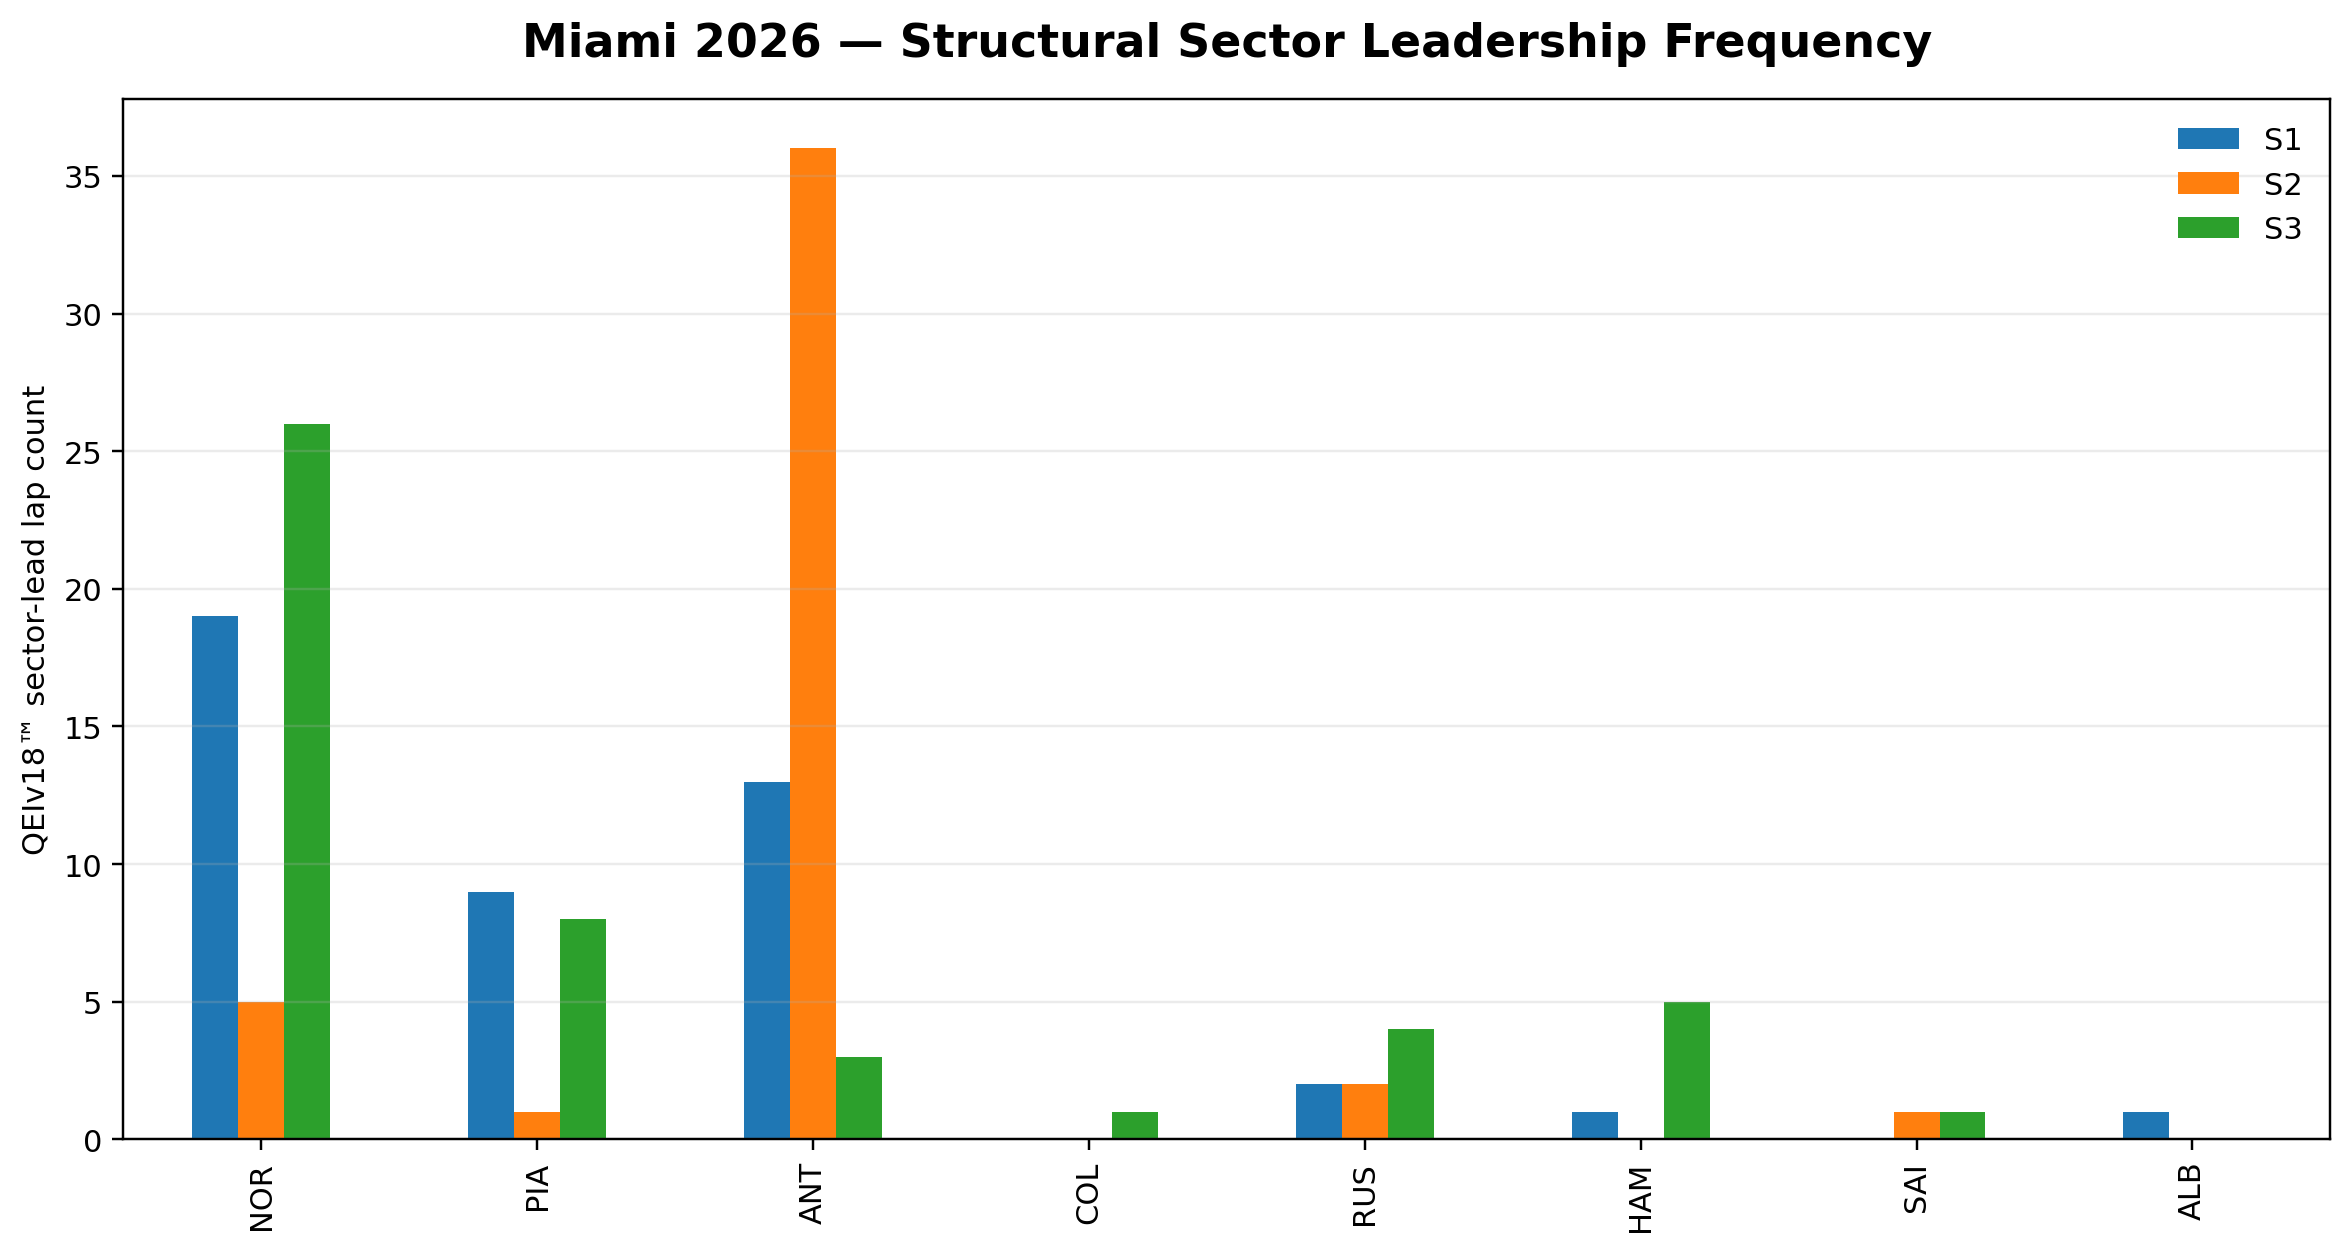
Structural sector-lead laps: 19
Avg field advantage: 0.795
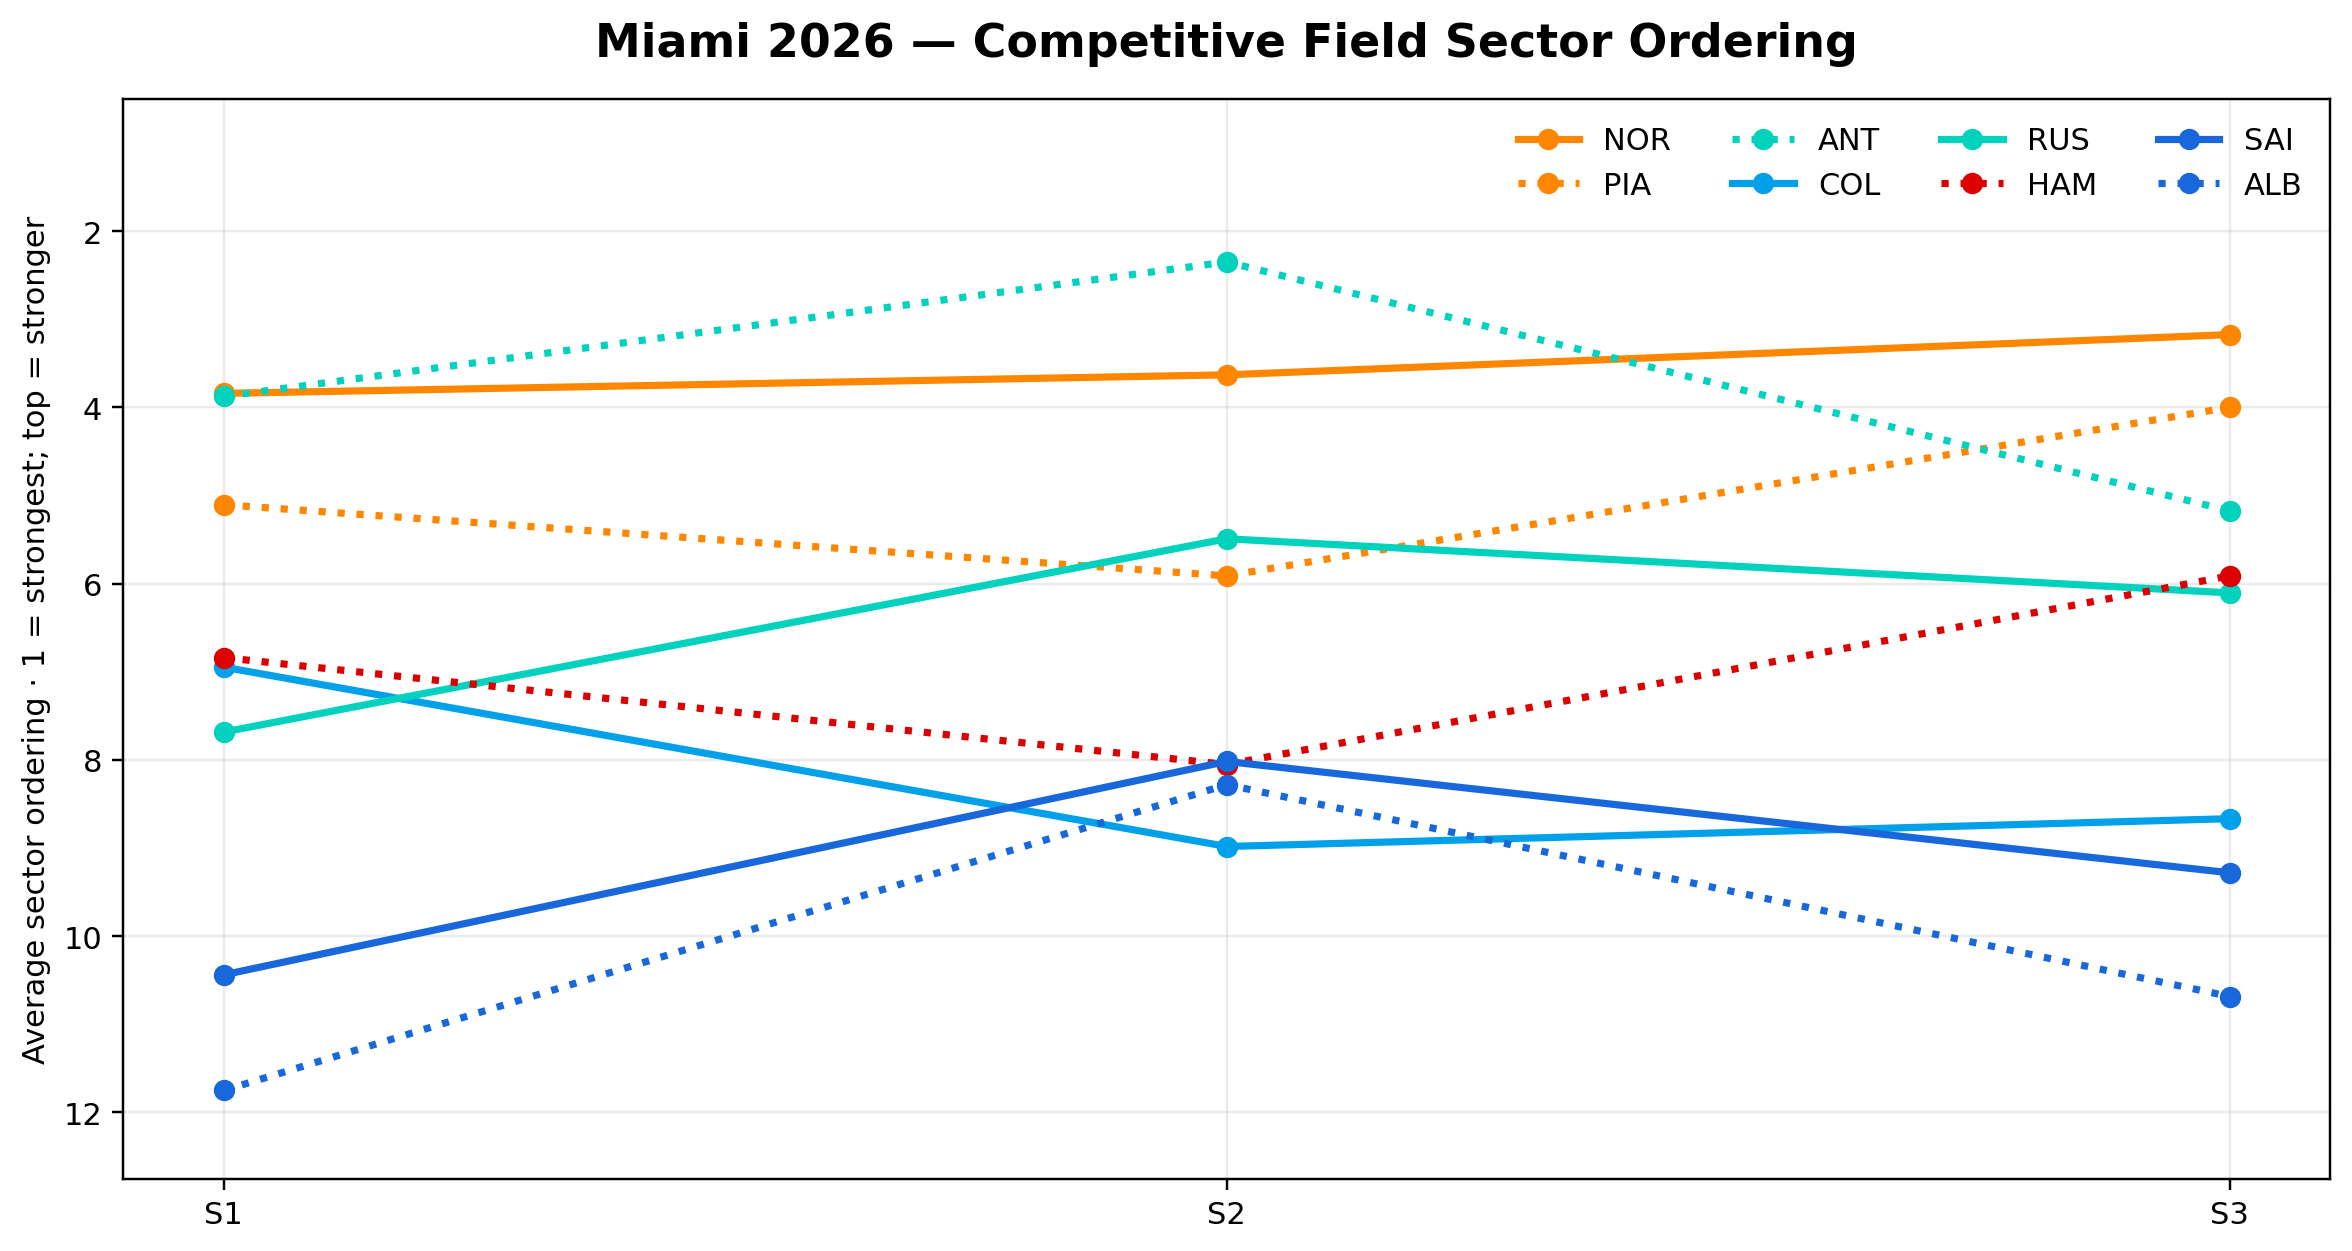
Avg sector ordering: 3.84
S2 leader
ANT
Mercedes
Structural sector-lead laps: 36
Avg field advantage: 1.285
Avg sector ordering: 2.35
S3 leader
NOR
McLaren
Structural sector-lead laps: 26
Avg field advantage: 0.964
Avg sector ordering: 3.18
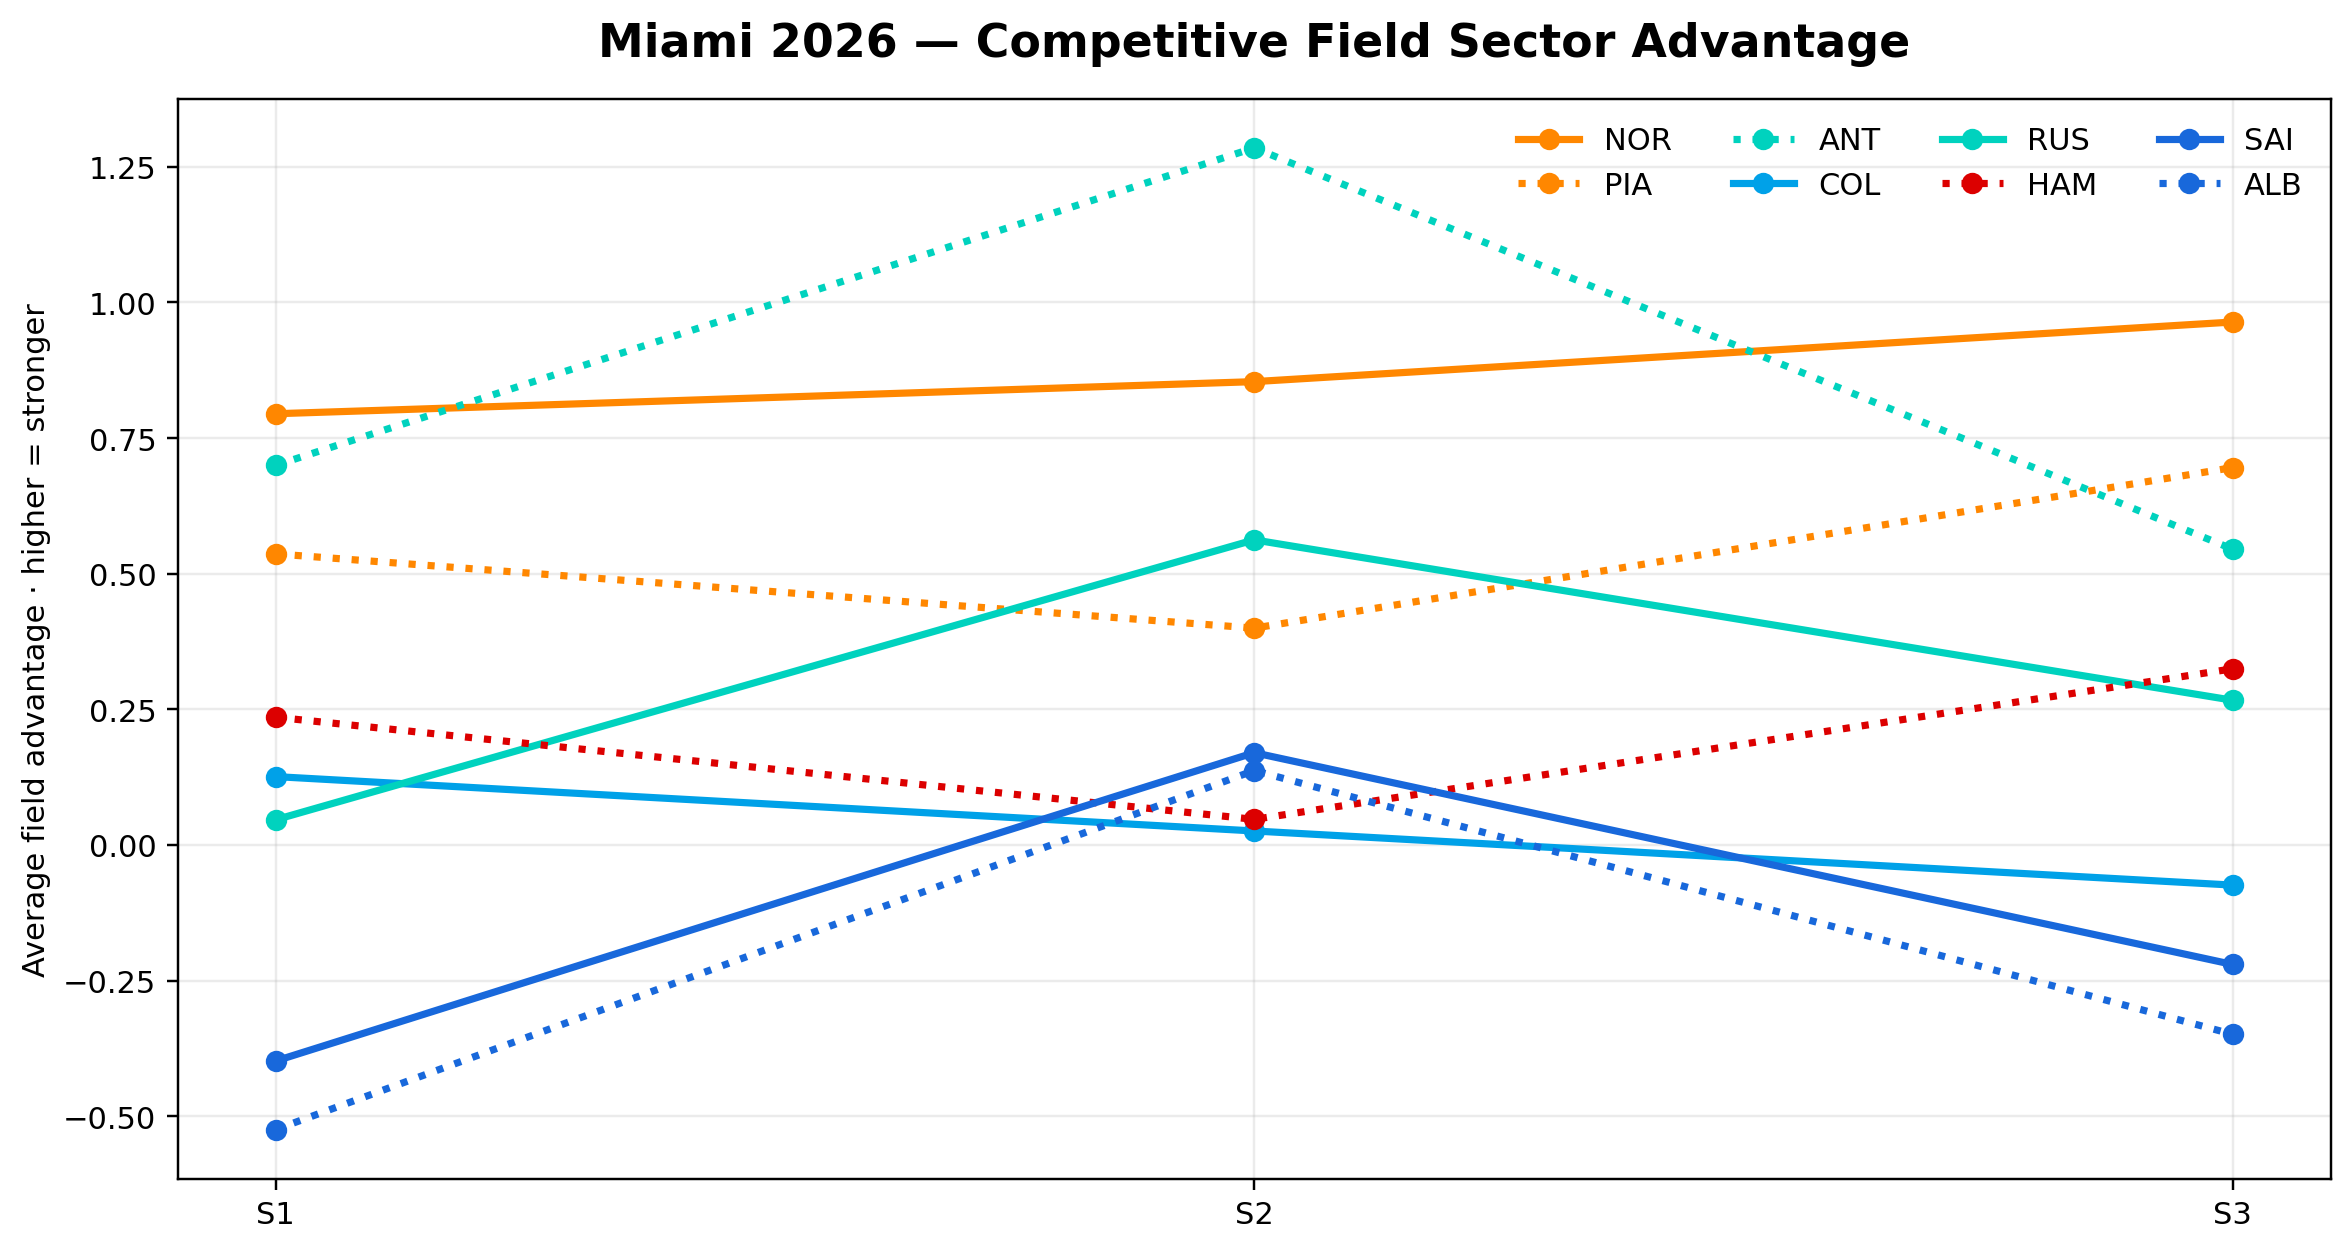
Sector Advantage Intensity
Average field advantage by sector · higher = stronger
Open PDF
Sector Advantage Intensity
Norris holds the strongest S1 and S3 profile, while Antonelli produces the clearest S2 control signature. The race is therefore split by sector phase rather than controlled uniformly by one driver.
Sector Ordering Map
Average sector ordering · 1 = strongest; top = stronger
Open PDF
Sector Ordering Map
The ordering map confirms where the strongest sector structure repeats across the field.
Structural Sector Leadership Frequency
Count of laps where QEIv18™ ranks a driver strongest in that sector
Open PDF
Structural Sector Leadership Frequency
This counts how often a driver leads the sector in QEIv18™ field-relative structure. Norris dominates the structural leadership count in S1 and S3, while Antonelli dominates S2.

Competitive field

Competitive field is defined here as the top eight drivers in the Miami QEIv18™ race-state table.
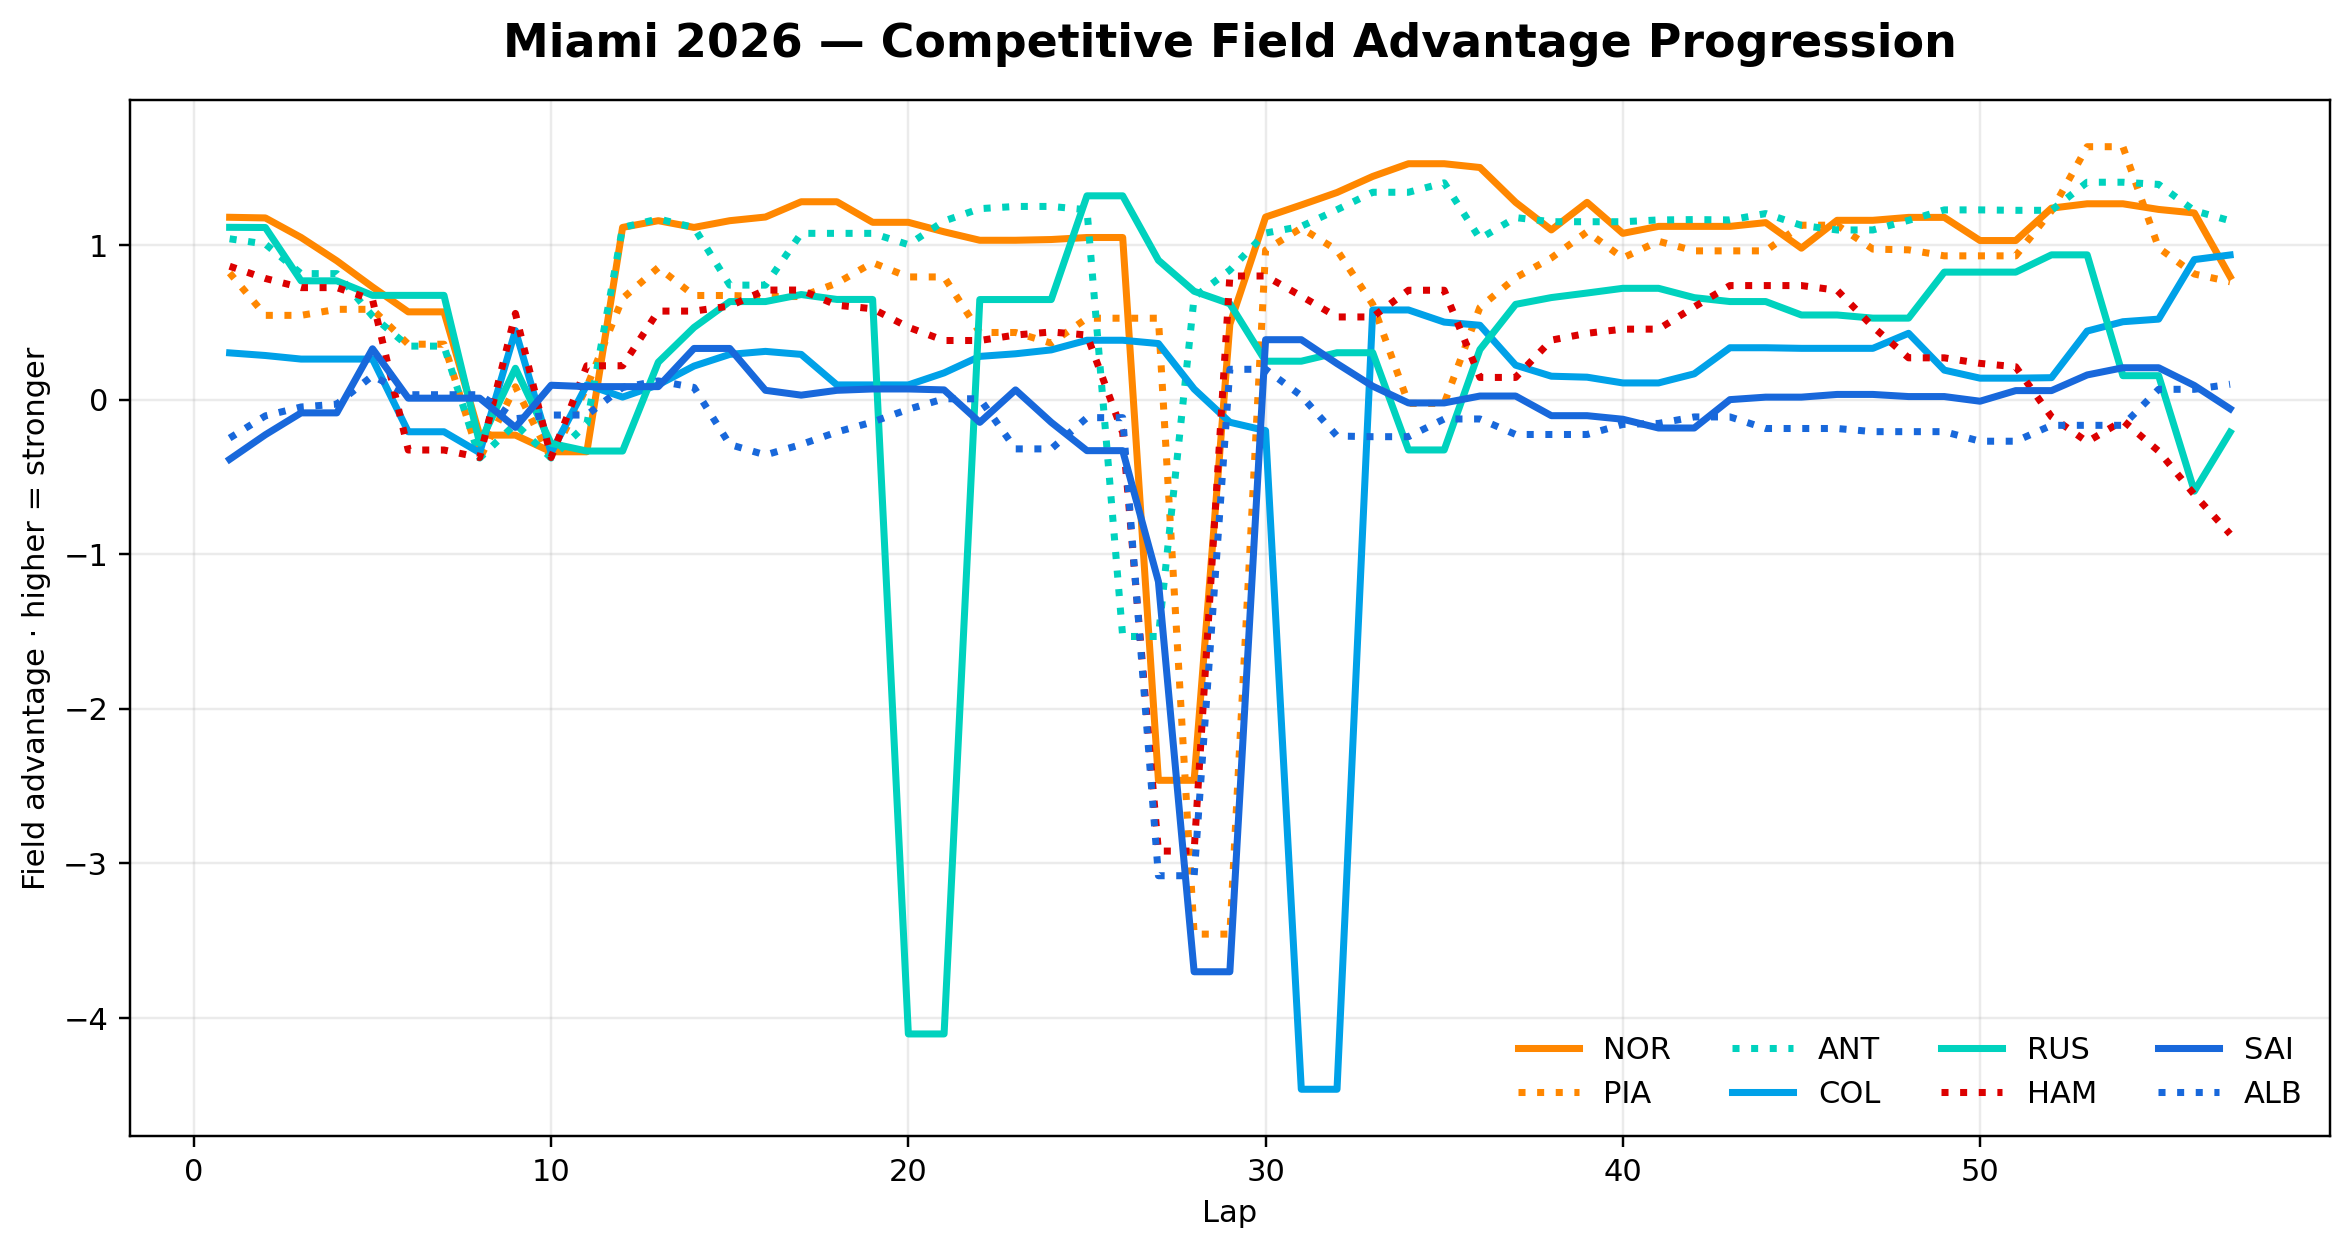
Competitive Field Advantage Progression
Field advantage by lap · higher = stronger
Open PDF
Competitive Field Advantage Progression
This progression view shows how advantage develops across the race rather than only at the finish.
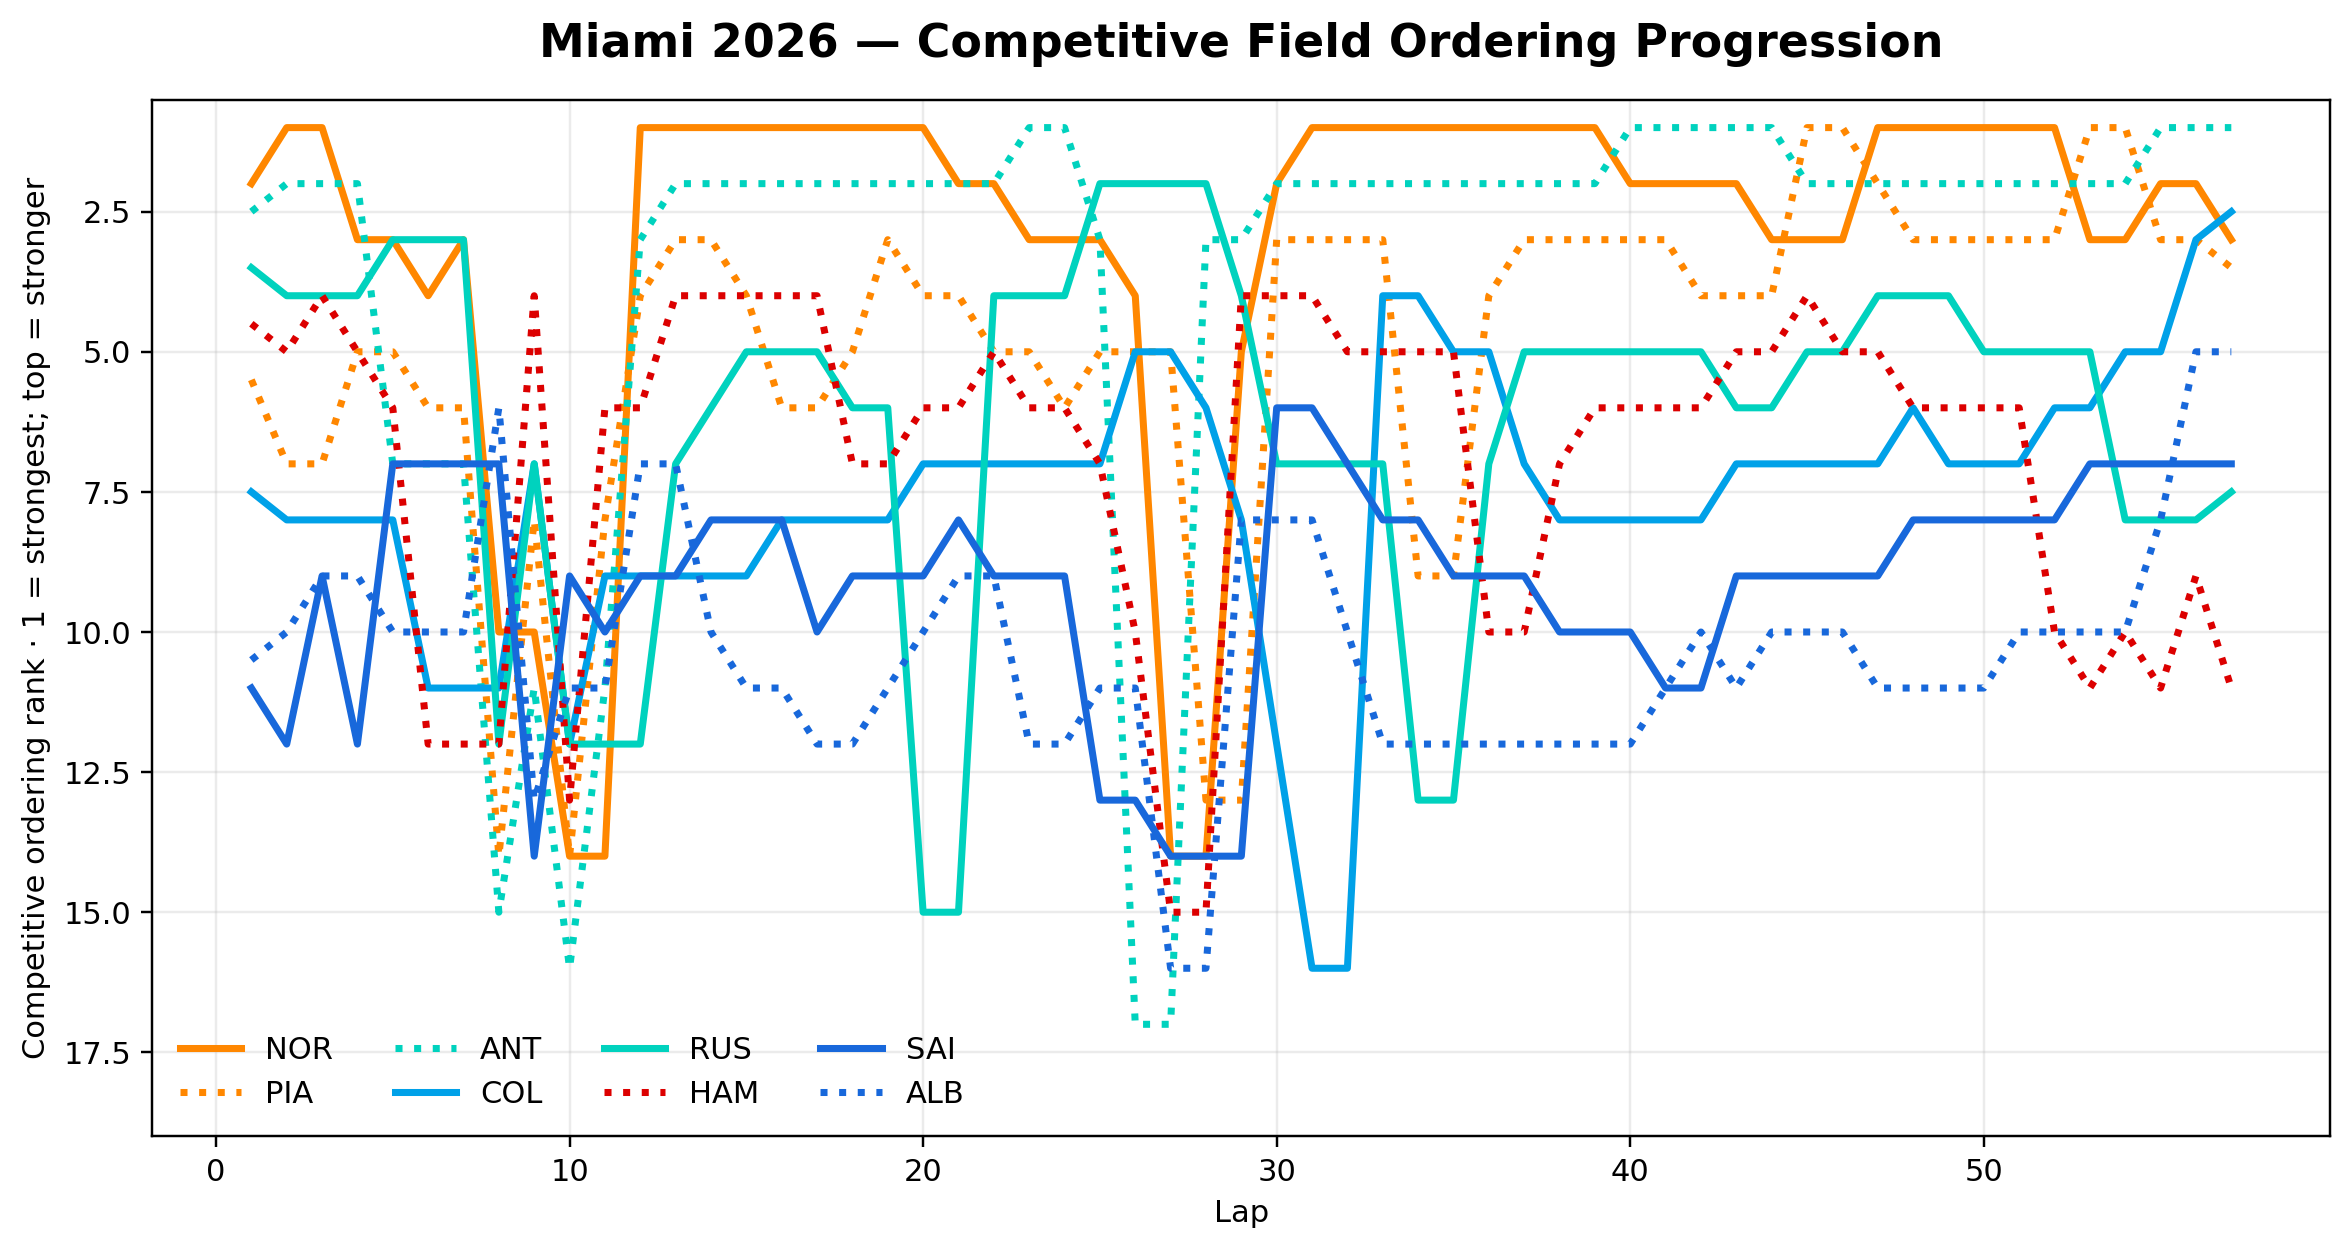
Competitive Field Ordering Progression
Competitive ordering by lap · 1 = strongest; top = stronger
Open PDF
Competitive Field Ordering Progression
Rank 1 is strongest and appears at the top of the chart. The ordering layer separates visible race position from structural competitive position.

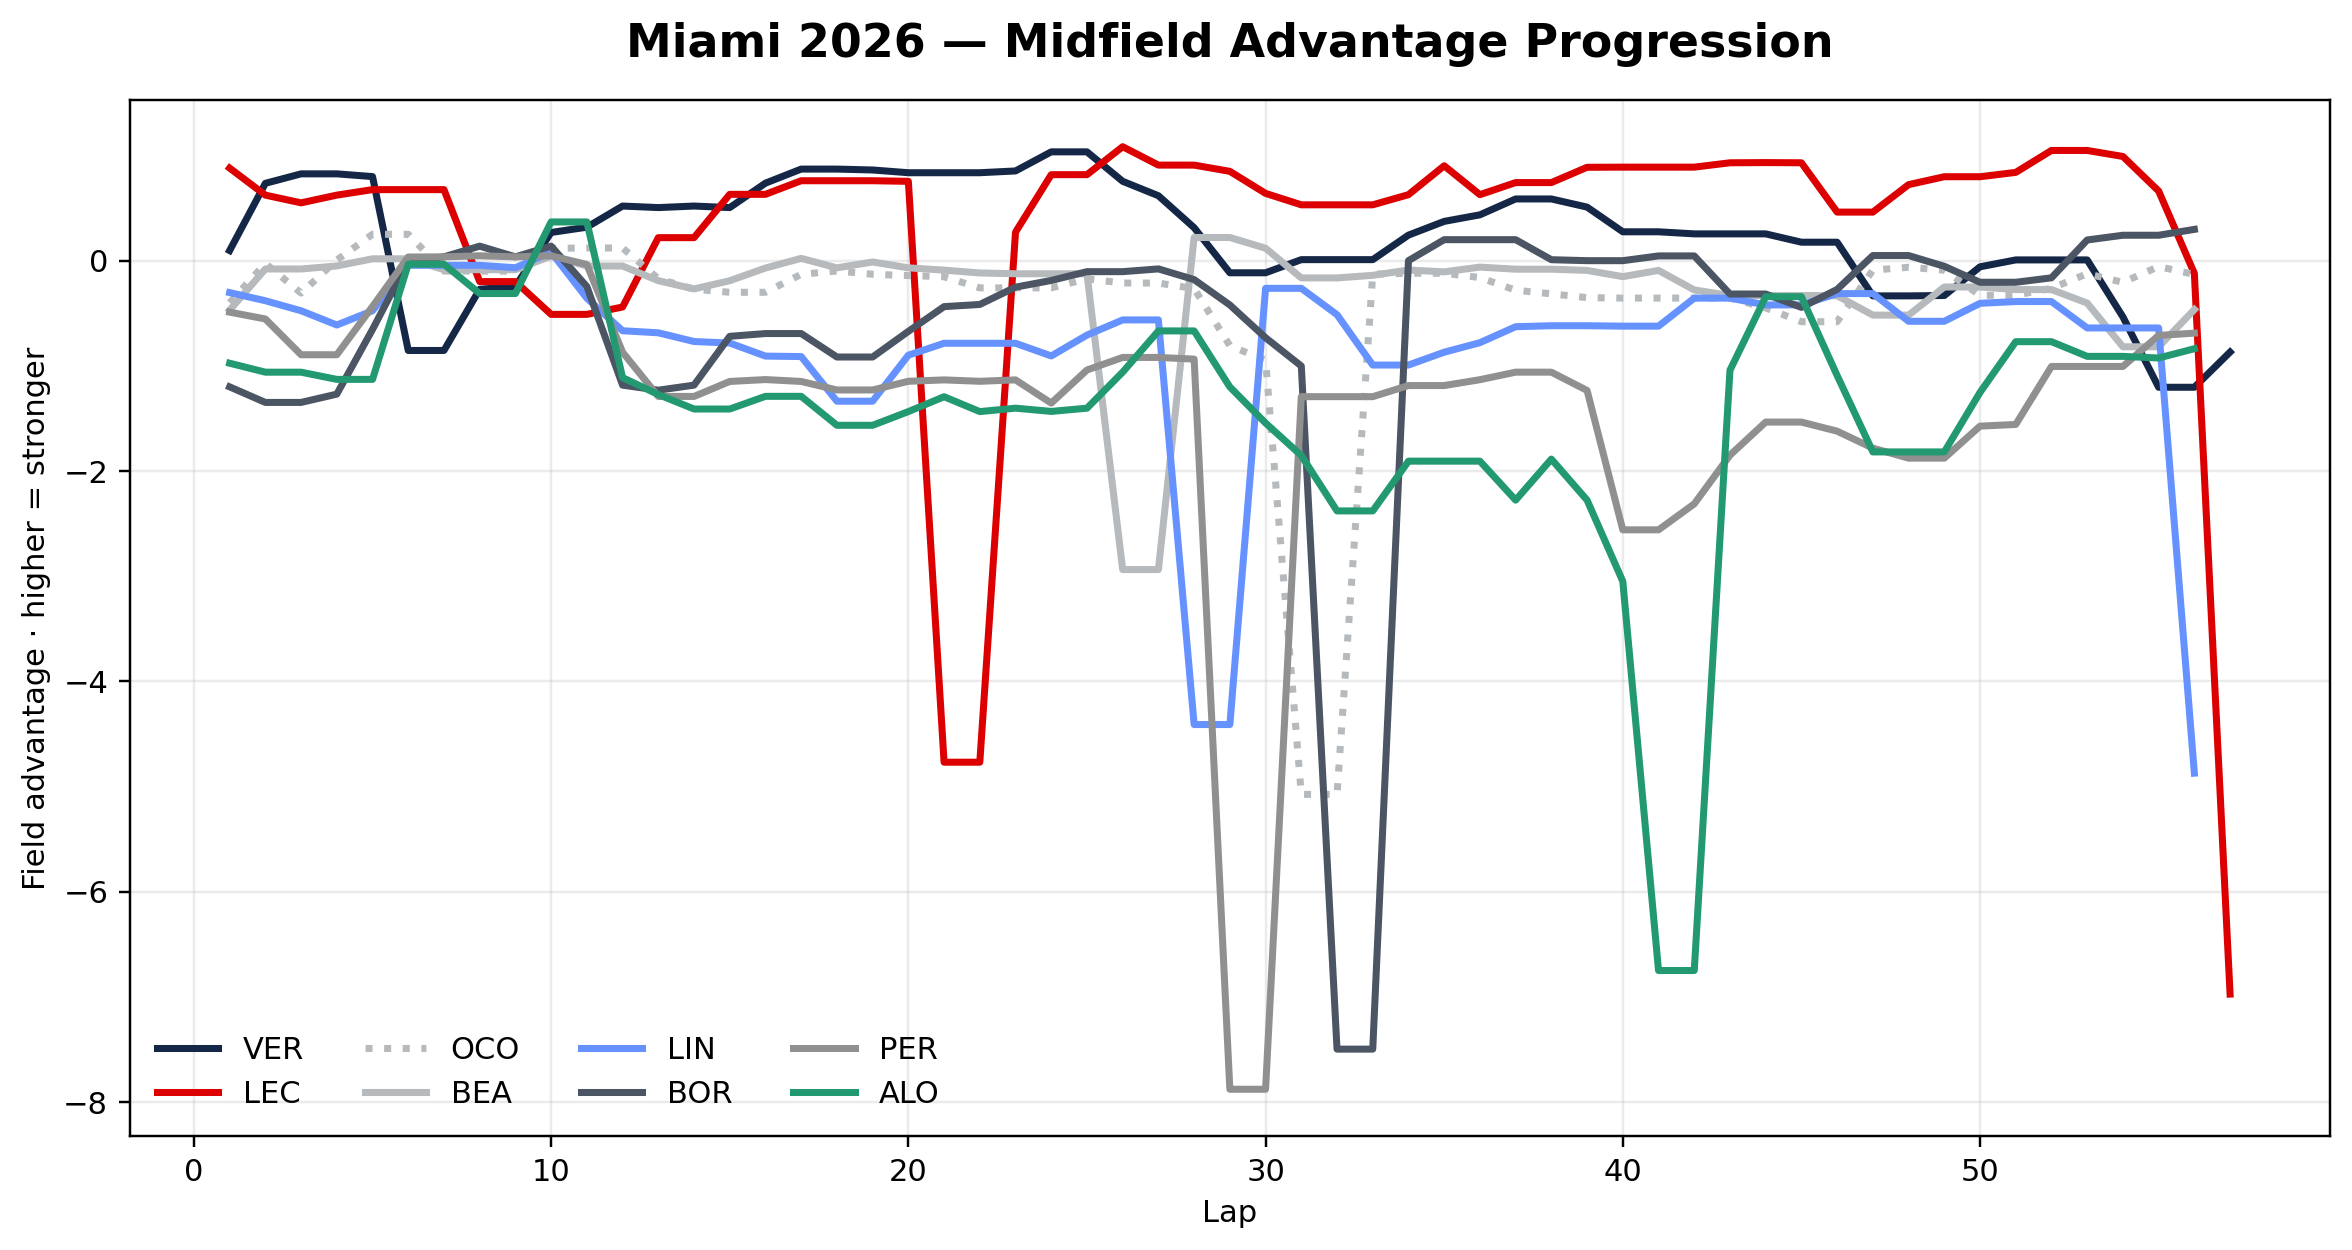
Midfield

Midfield is defined here as drivers ranked 9–16 in the Miami QEIv18™ race-state table. This is an event layer, not a permanent driver-quality category.
Midfield Advantage Progression
Field advantage by lap · higher = stronger
Open PDF
Midfield Advantage Progression
This layer identifies the strongest event-specific structures outside the competitive field.
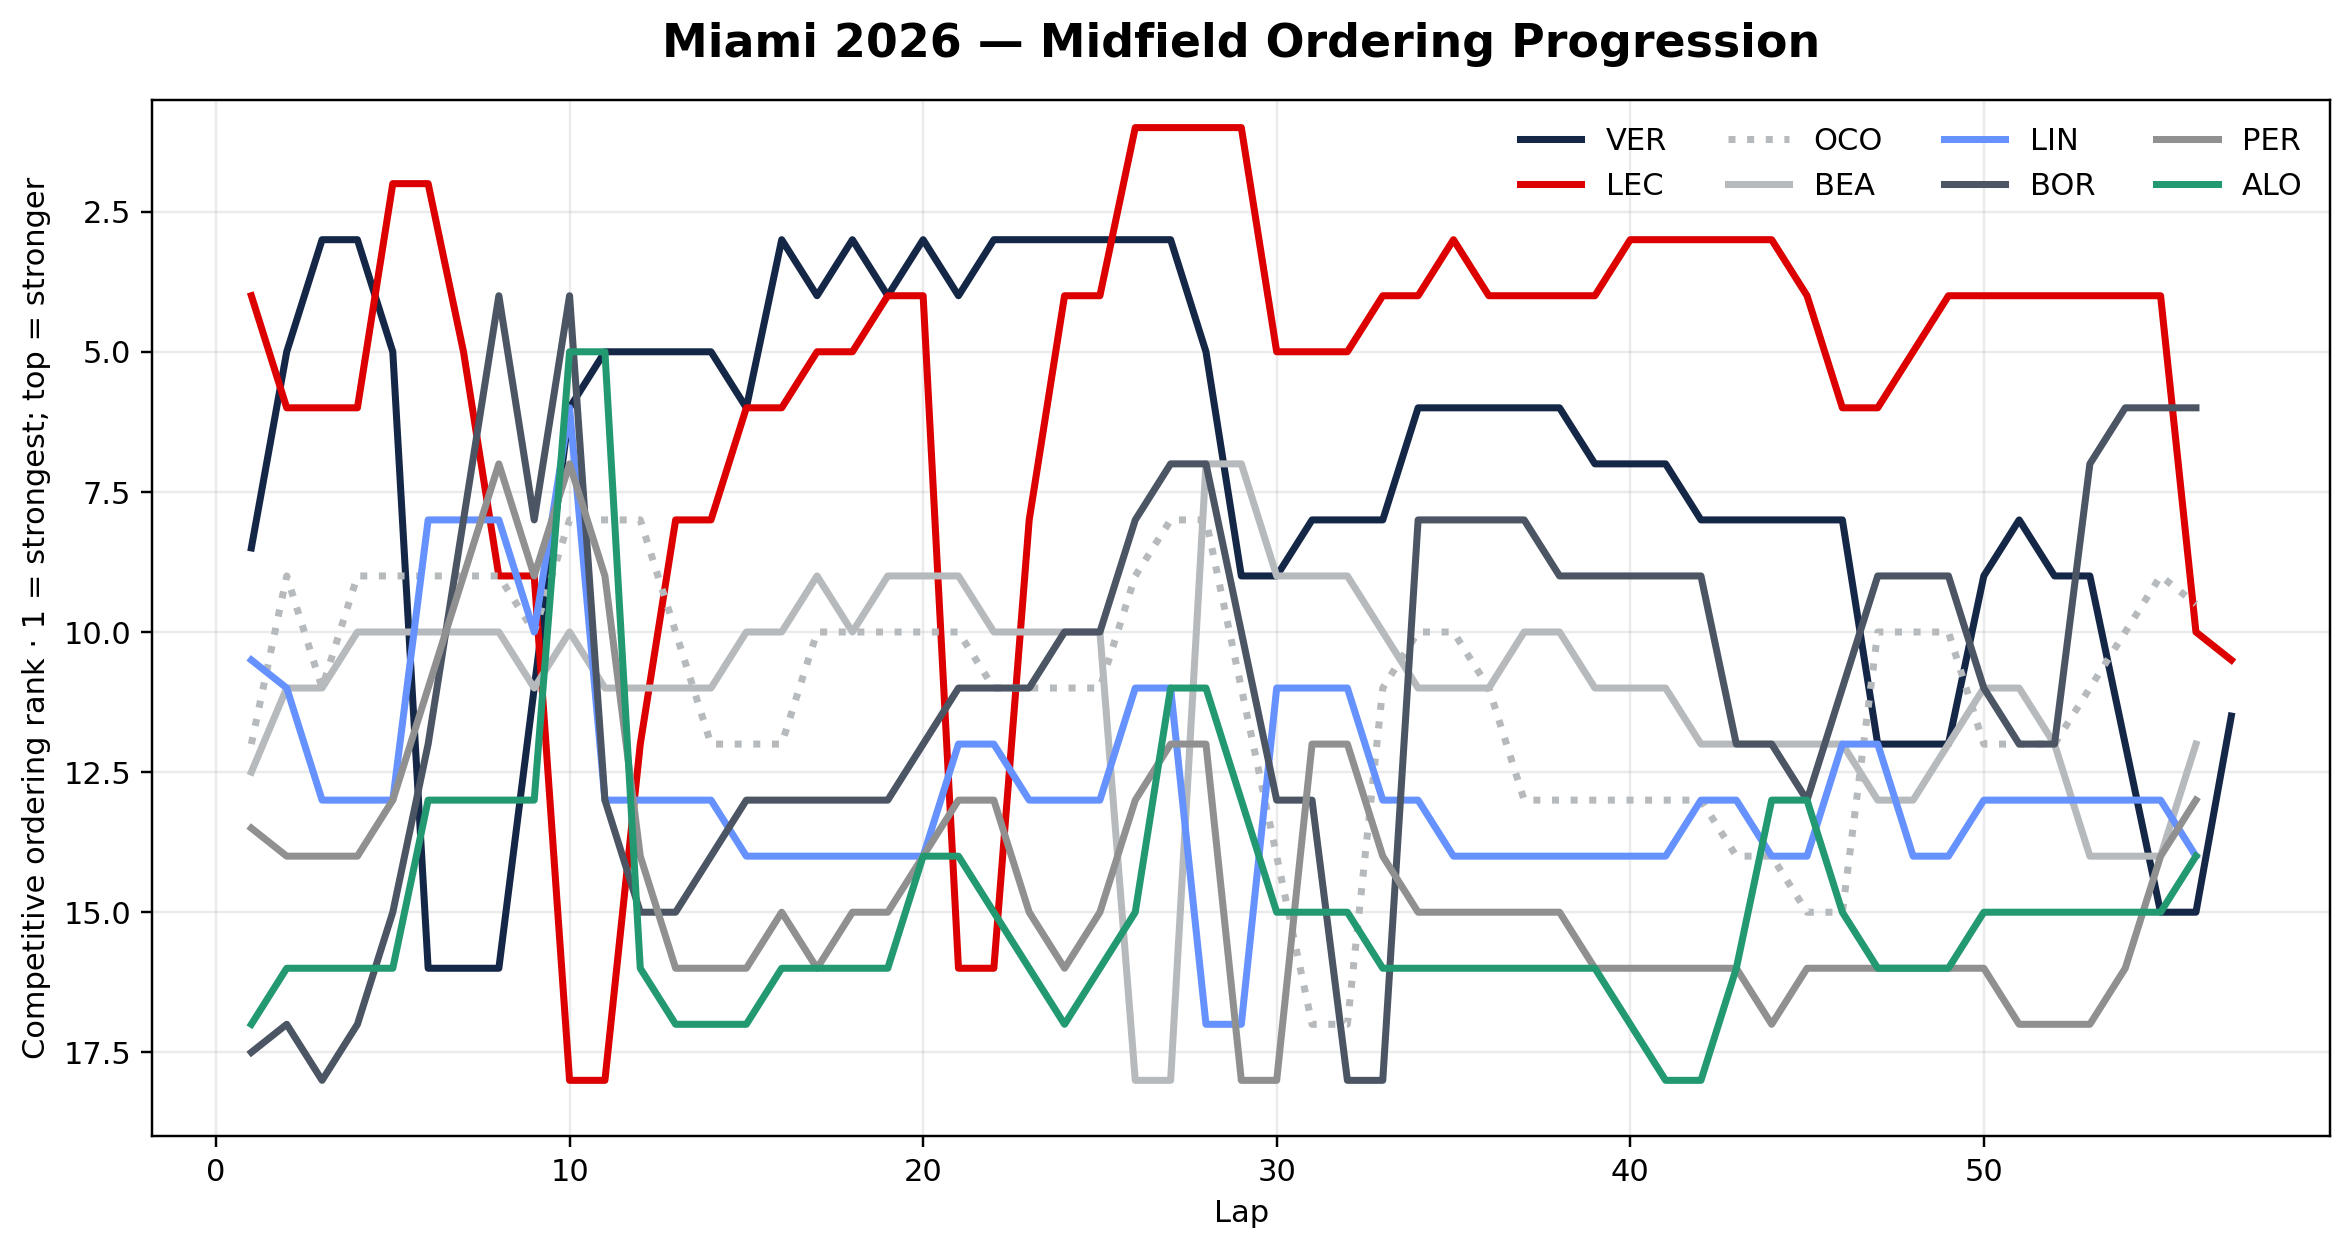
Midfield Ordering Progression
Competitive ordering by lap · 1 = strongest; top = stronger
Open PDF
Midfield Ordering Progression
The midfield layer includes established front-line drivers when their Miami event structure places them outside the top eight.
Event-layer definition
The midfield label is based on Miami QEIv18™ race-state ranking only. It does not make a permanent claim about driver quality or team status.
Colapinto signal
Colapinto ranks fourth overall in Miami, so he is not treated as midfield in this event. He belongs inside the competitive field layer.
Williams layer
Sainz and Albon both sit inside the Miami top eight, showing stronger event-level field structure than their season position alone would imply.

Emerging driver structure

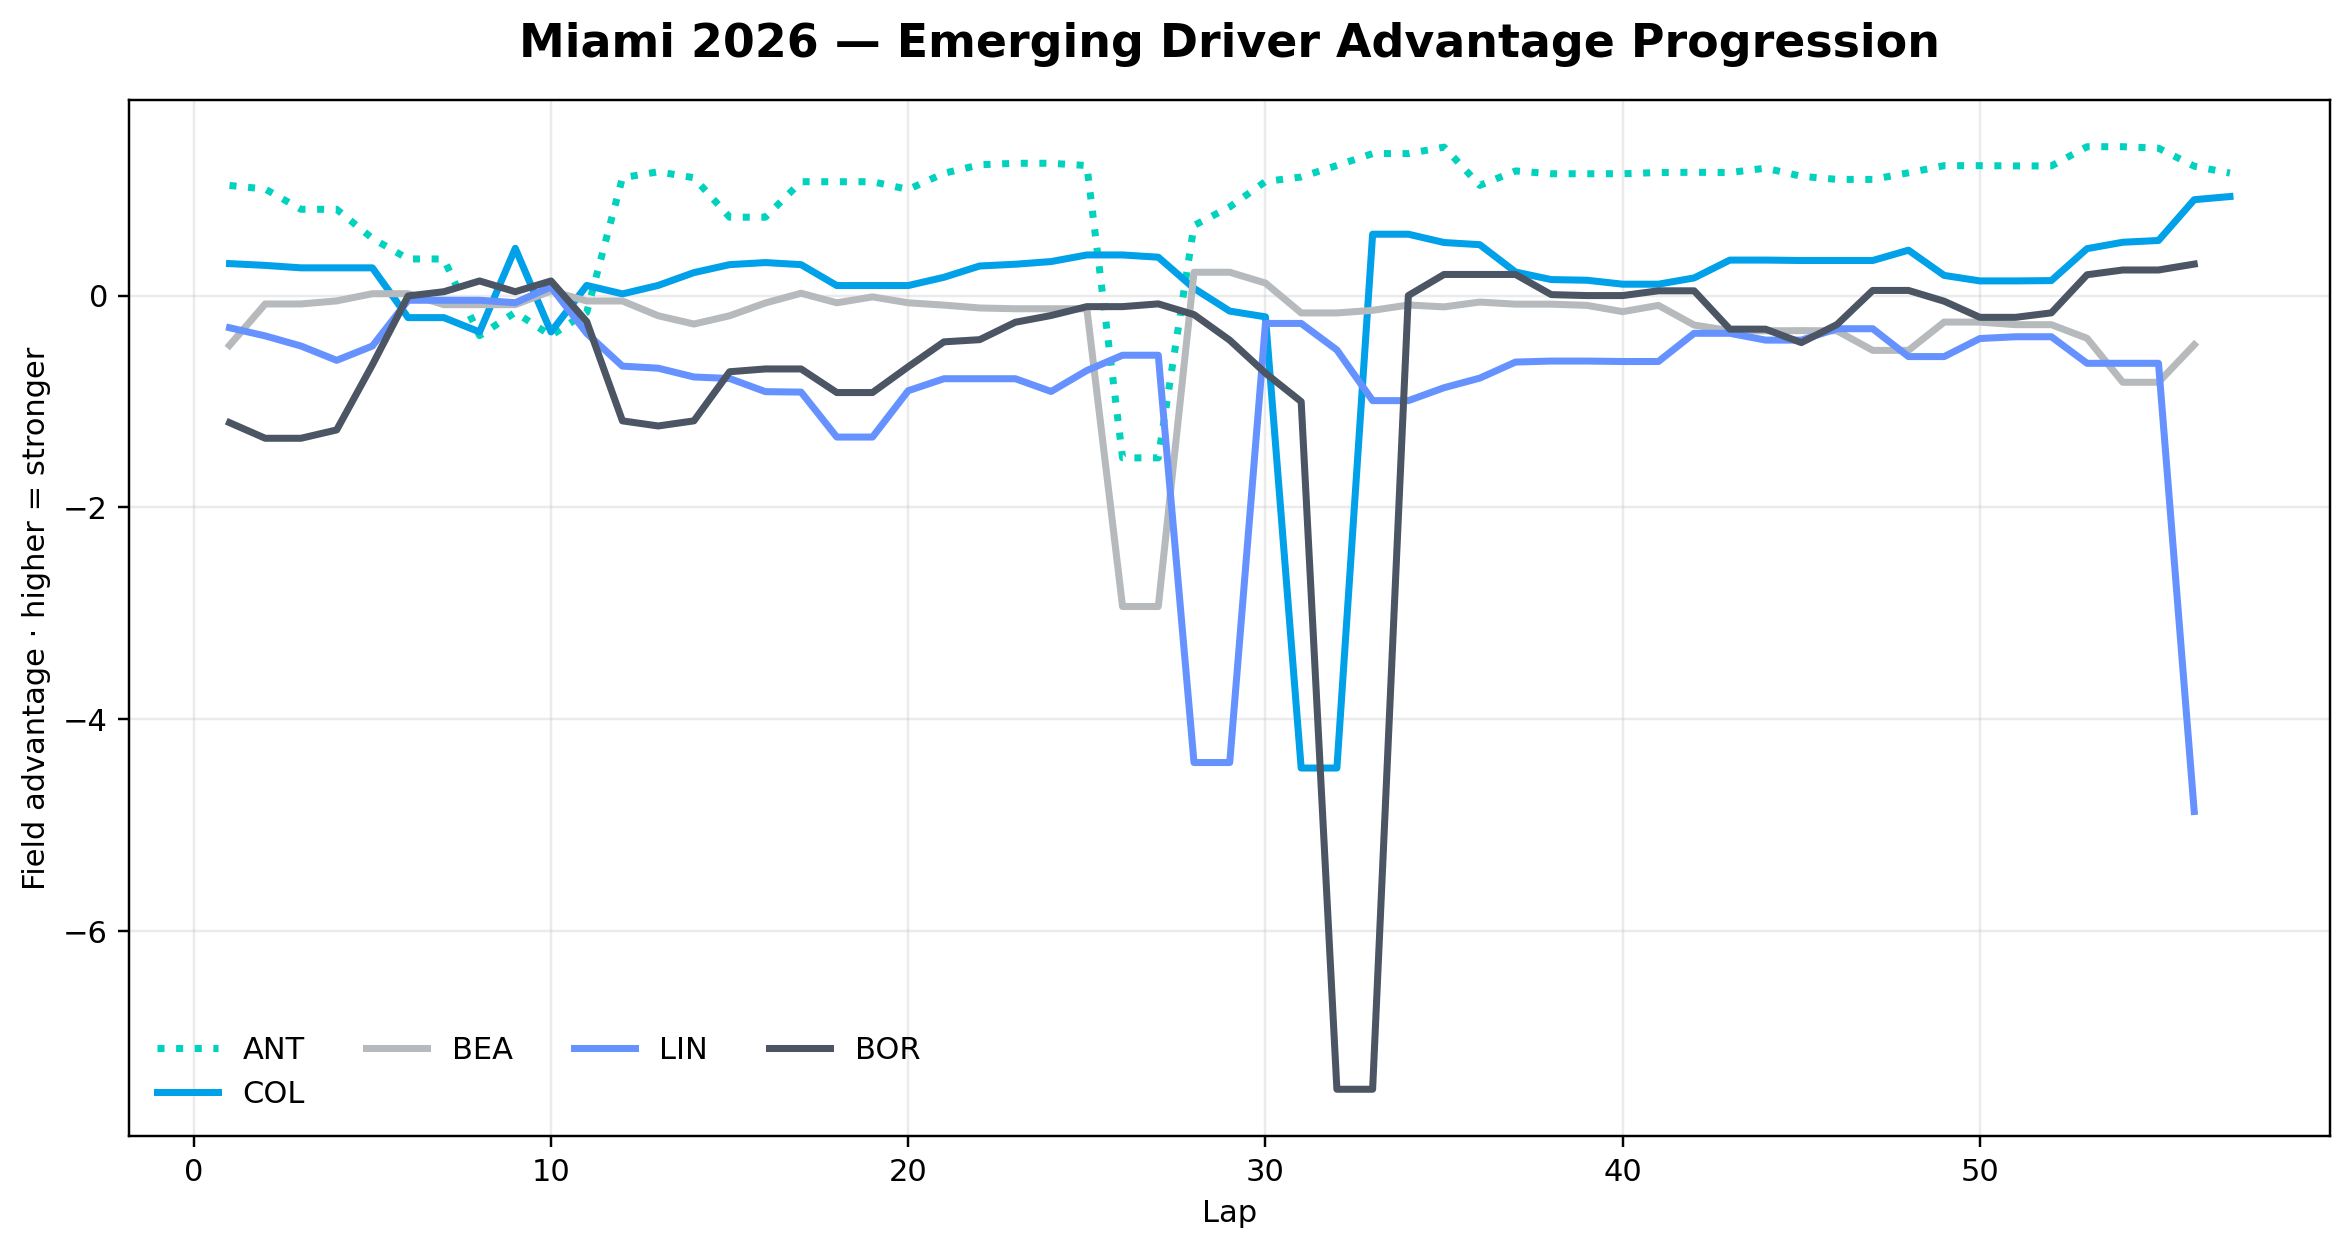
Emerging drivers are shown with the same progression layout as the midfield layer.
Emerging Driver Advantage Progression
Field advantage by lap · higher = stronger
Open PDF
Emerging Driver Advantage Progression
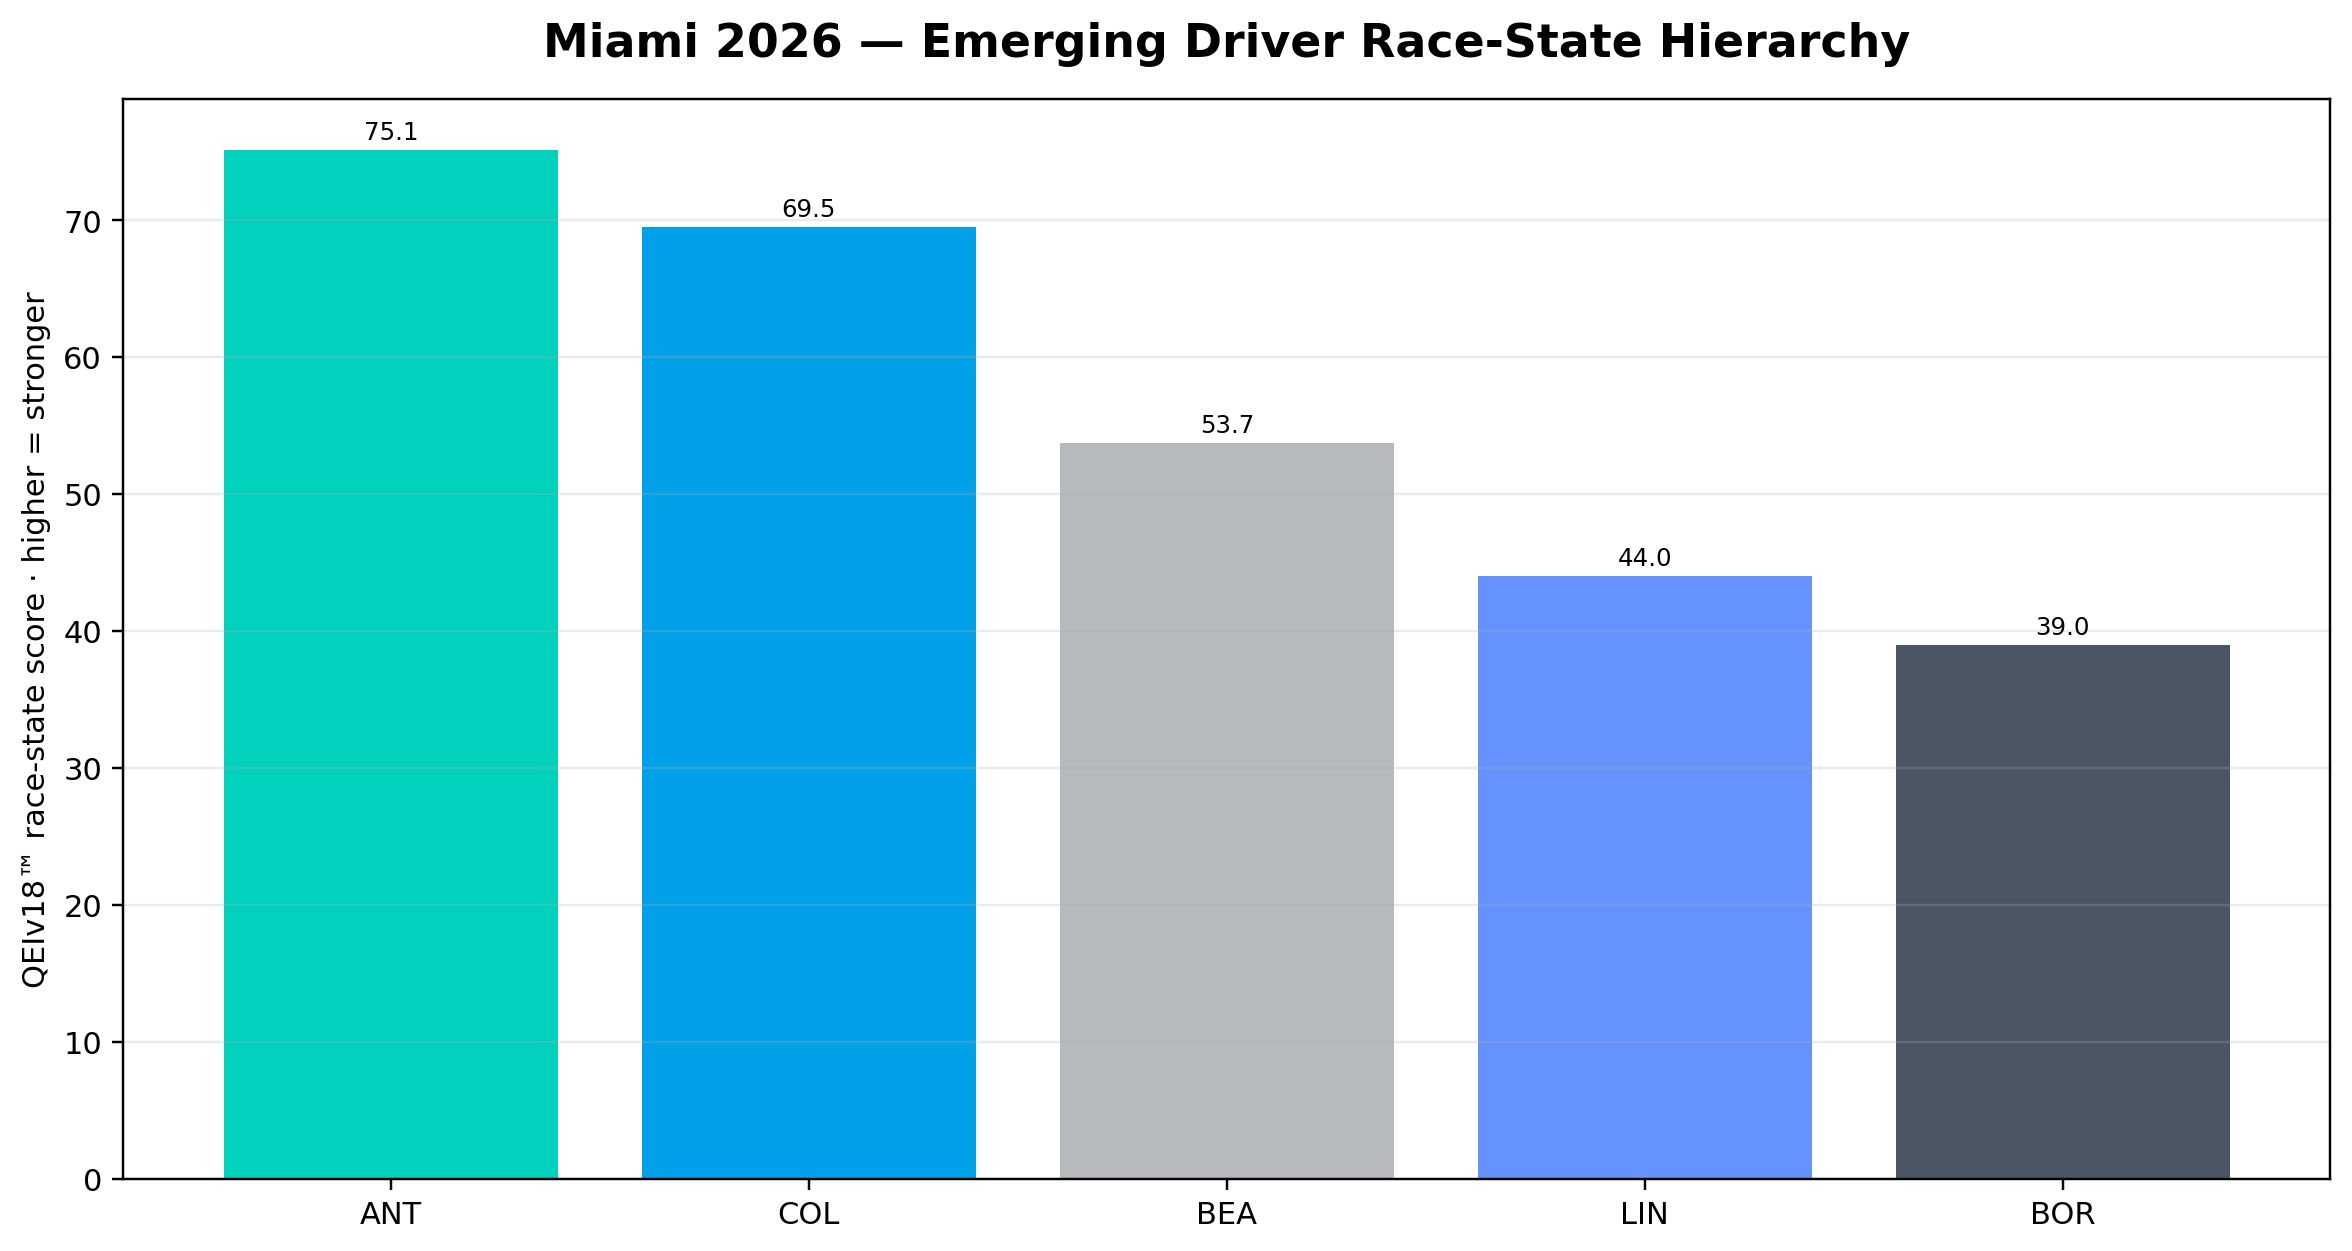
Antonelli remains the strongest emerging-driver reference across the season, while Miami elevates Colapinto as a major event-level signal.
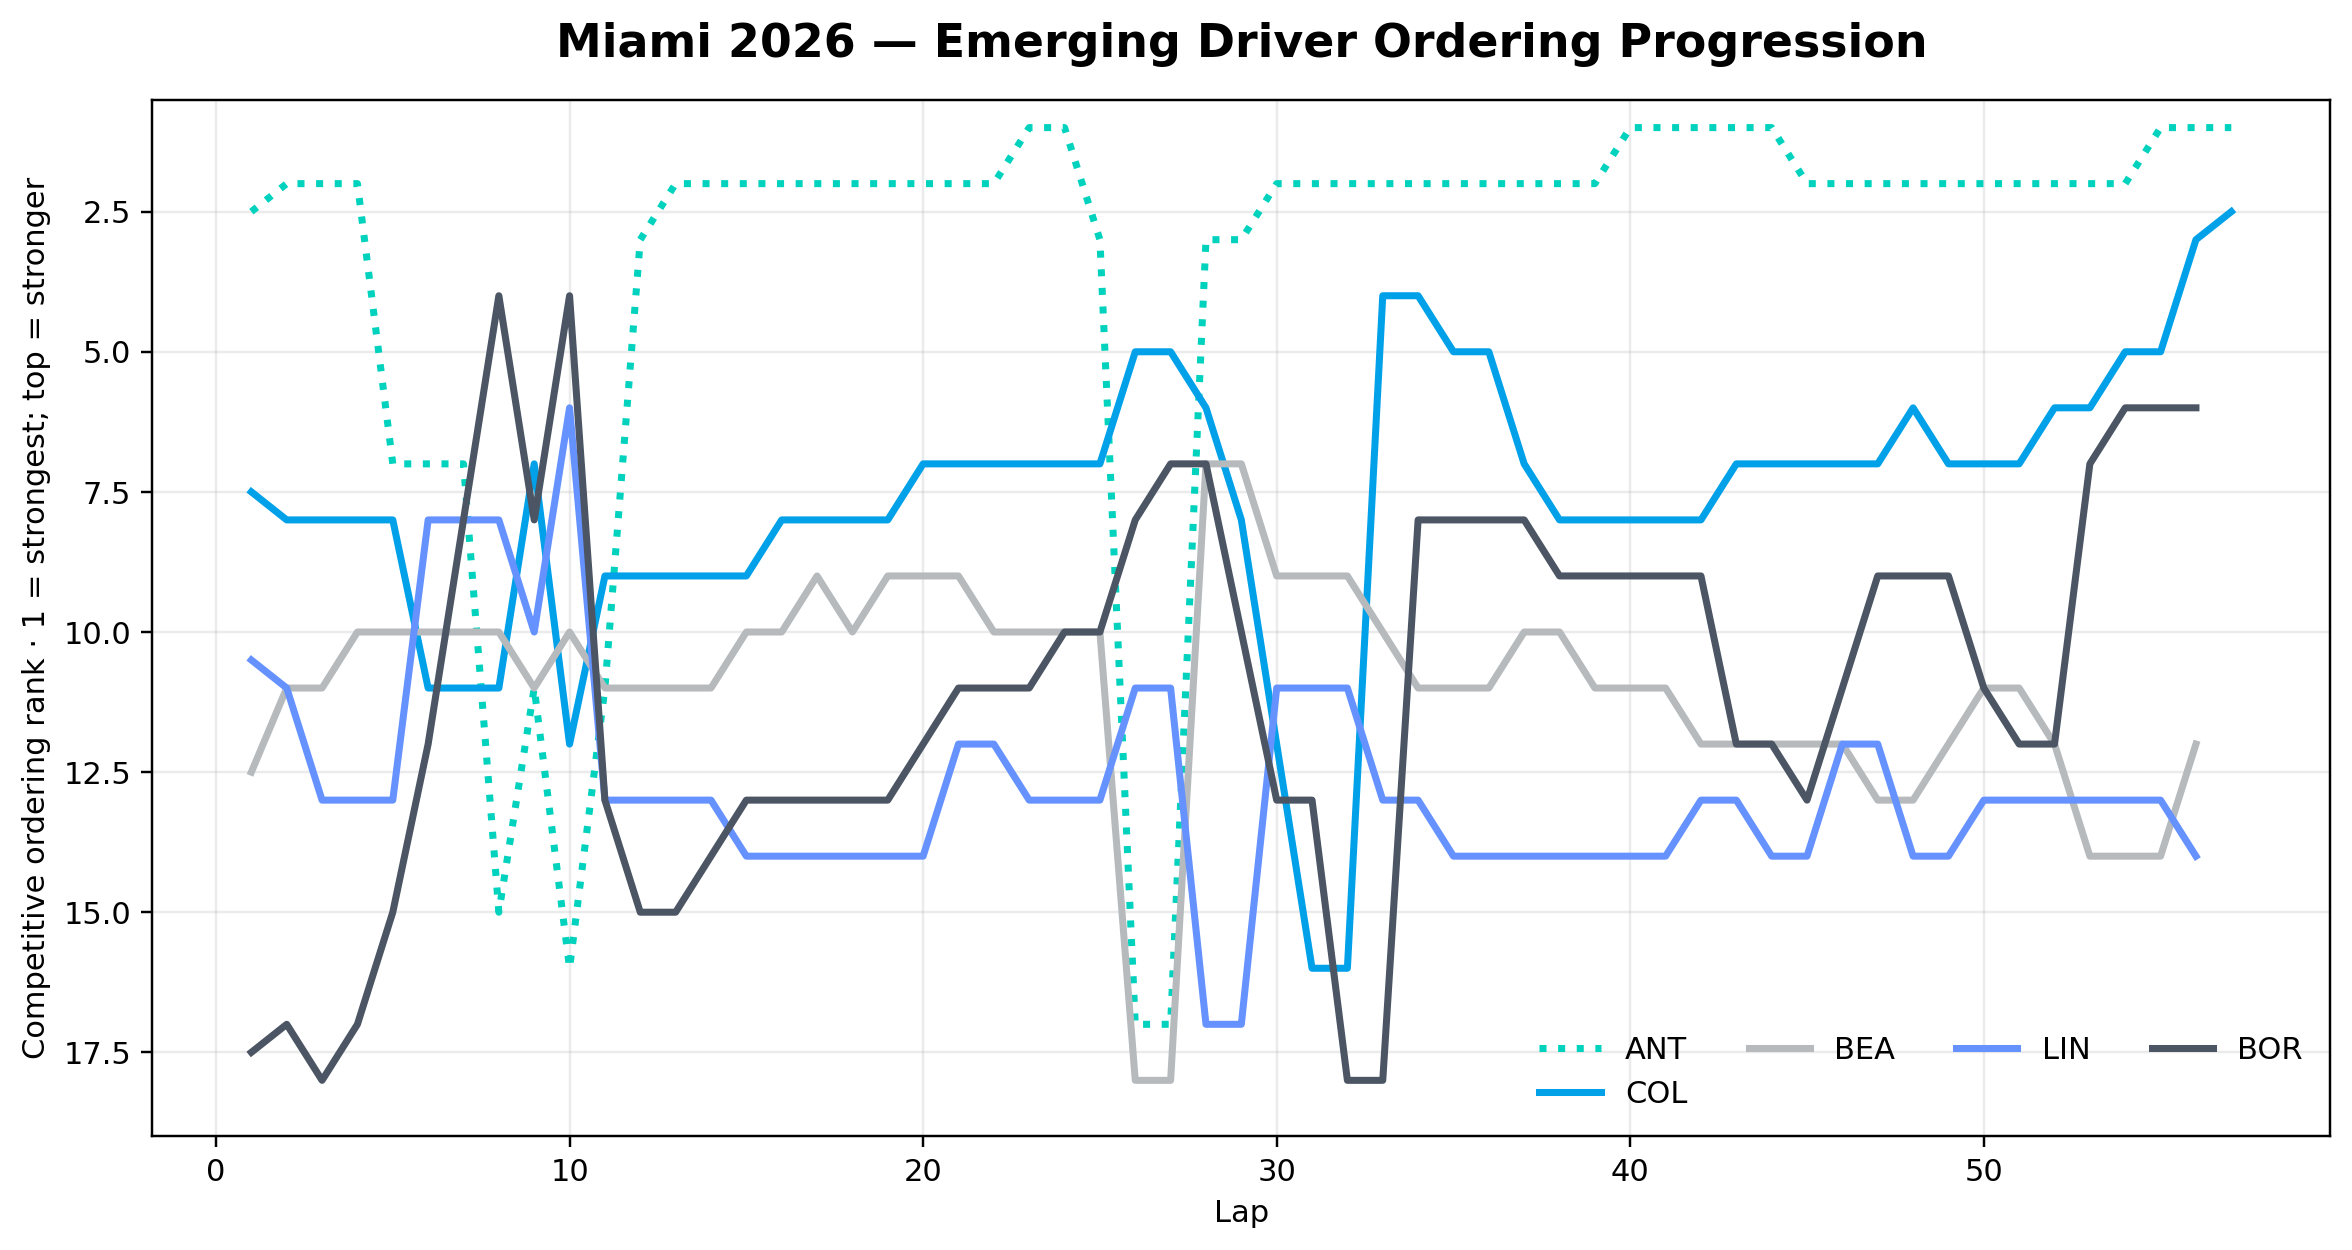
Emerging Driver Ordering Progression
Competitive ordering by lap · 1 = strongest; top = stronger
Open PDF
Emerging Driver Ordering Progression
Piastri is not included here because his Miami profile is treated as part of McLaren’s competitive-field layer.
Emerging Driver Race-State Hierarchy
ANT · COL · BEA · LIN · BOR
Open PDF
Emerging Driver Race-State Hierarchy
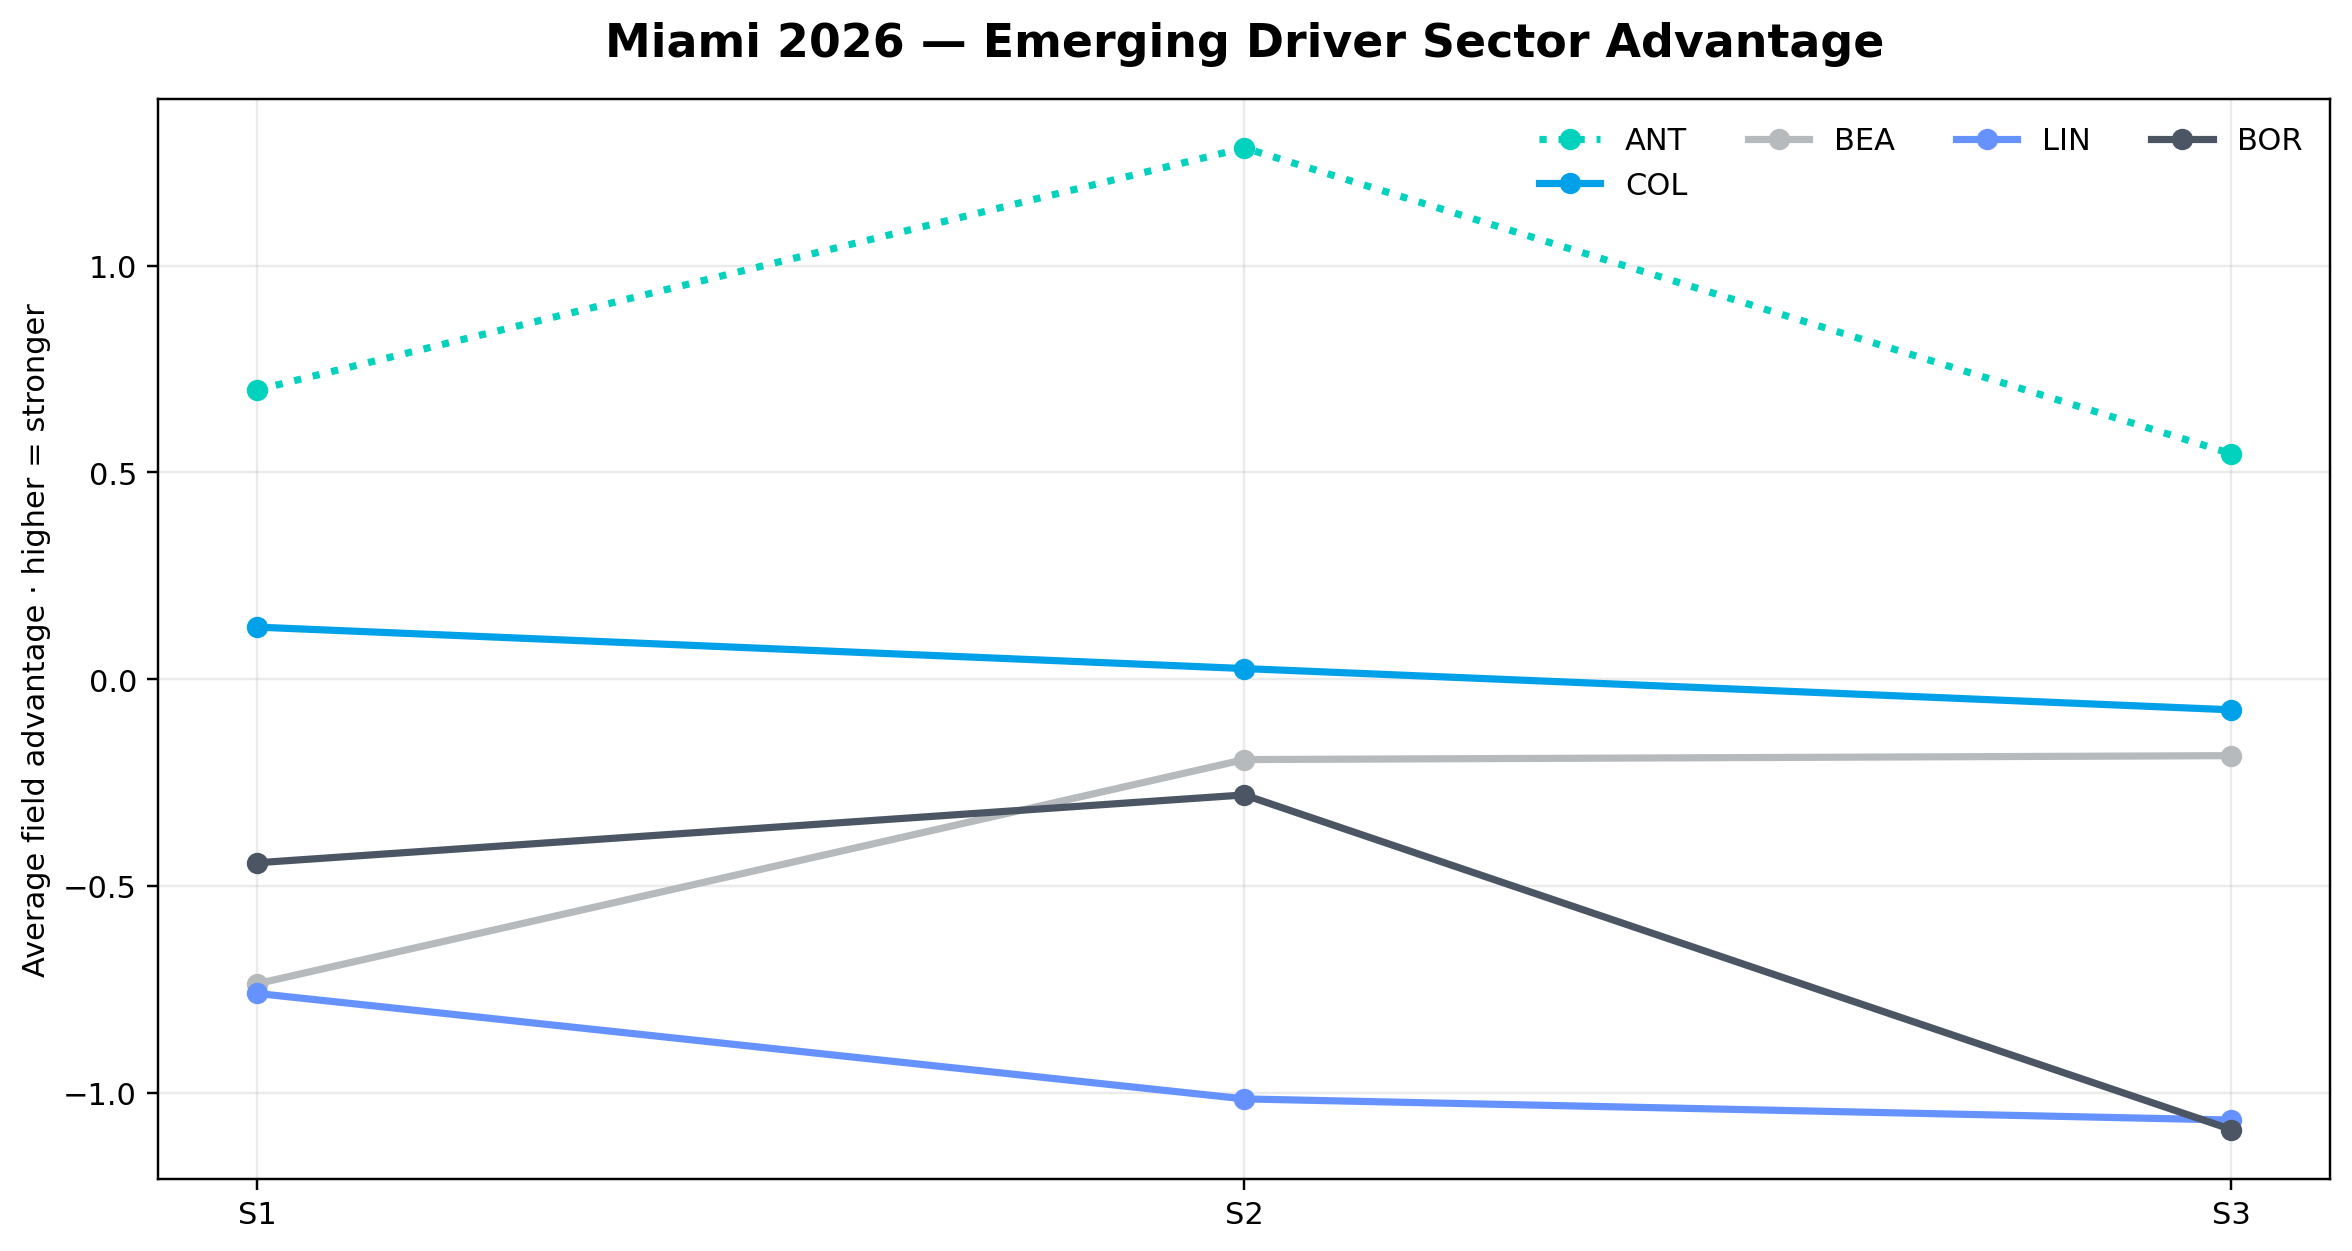
Emerging Driver Sector Advantage
Average field advantage by sector · higher = stronger
Open PDF
Emerging Driver Sector Advantage

Team-pair structure

Solid line is the first-listed driver; dotted line is the paired driver in the same team colour.
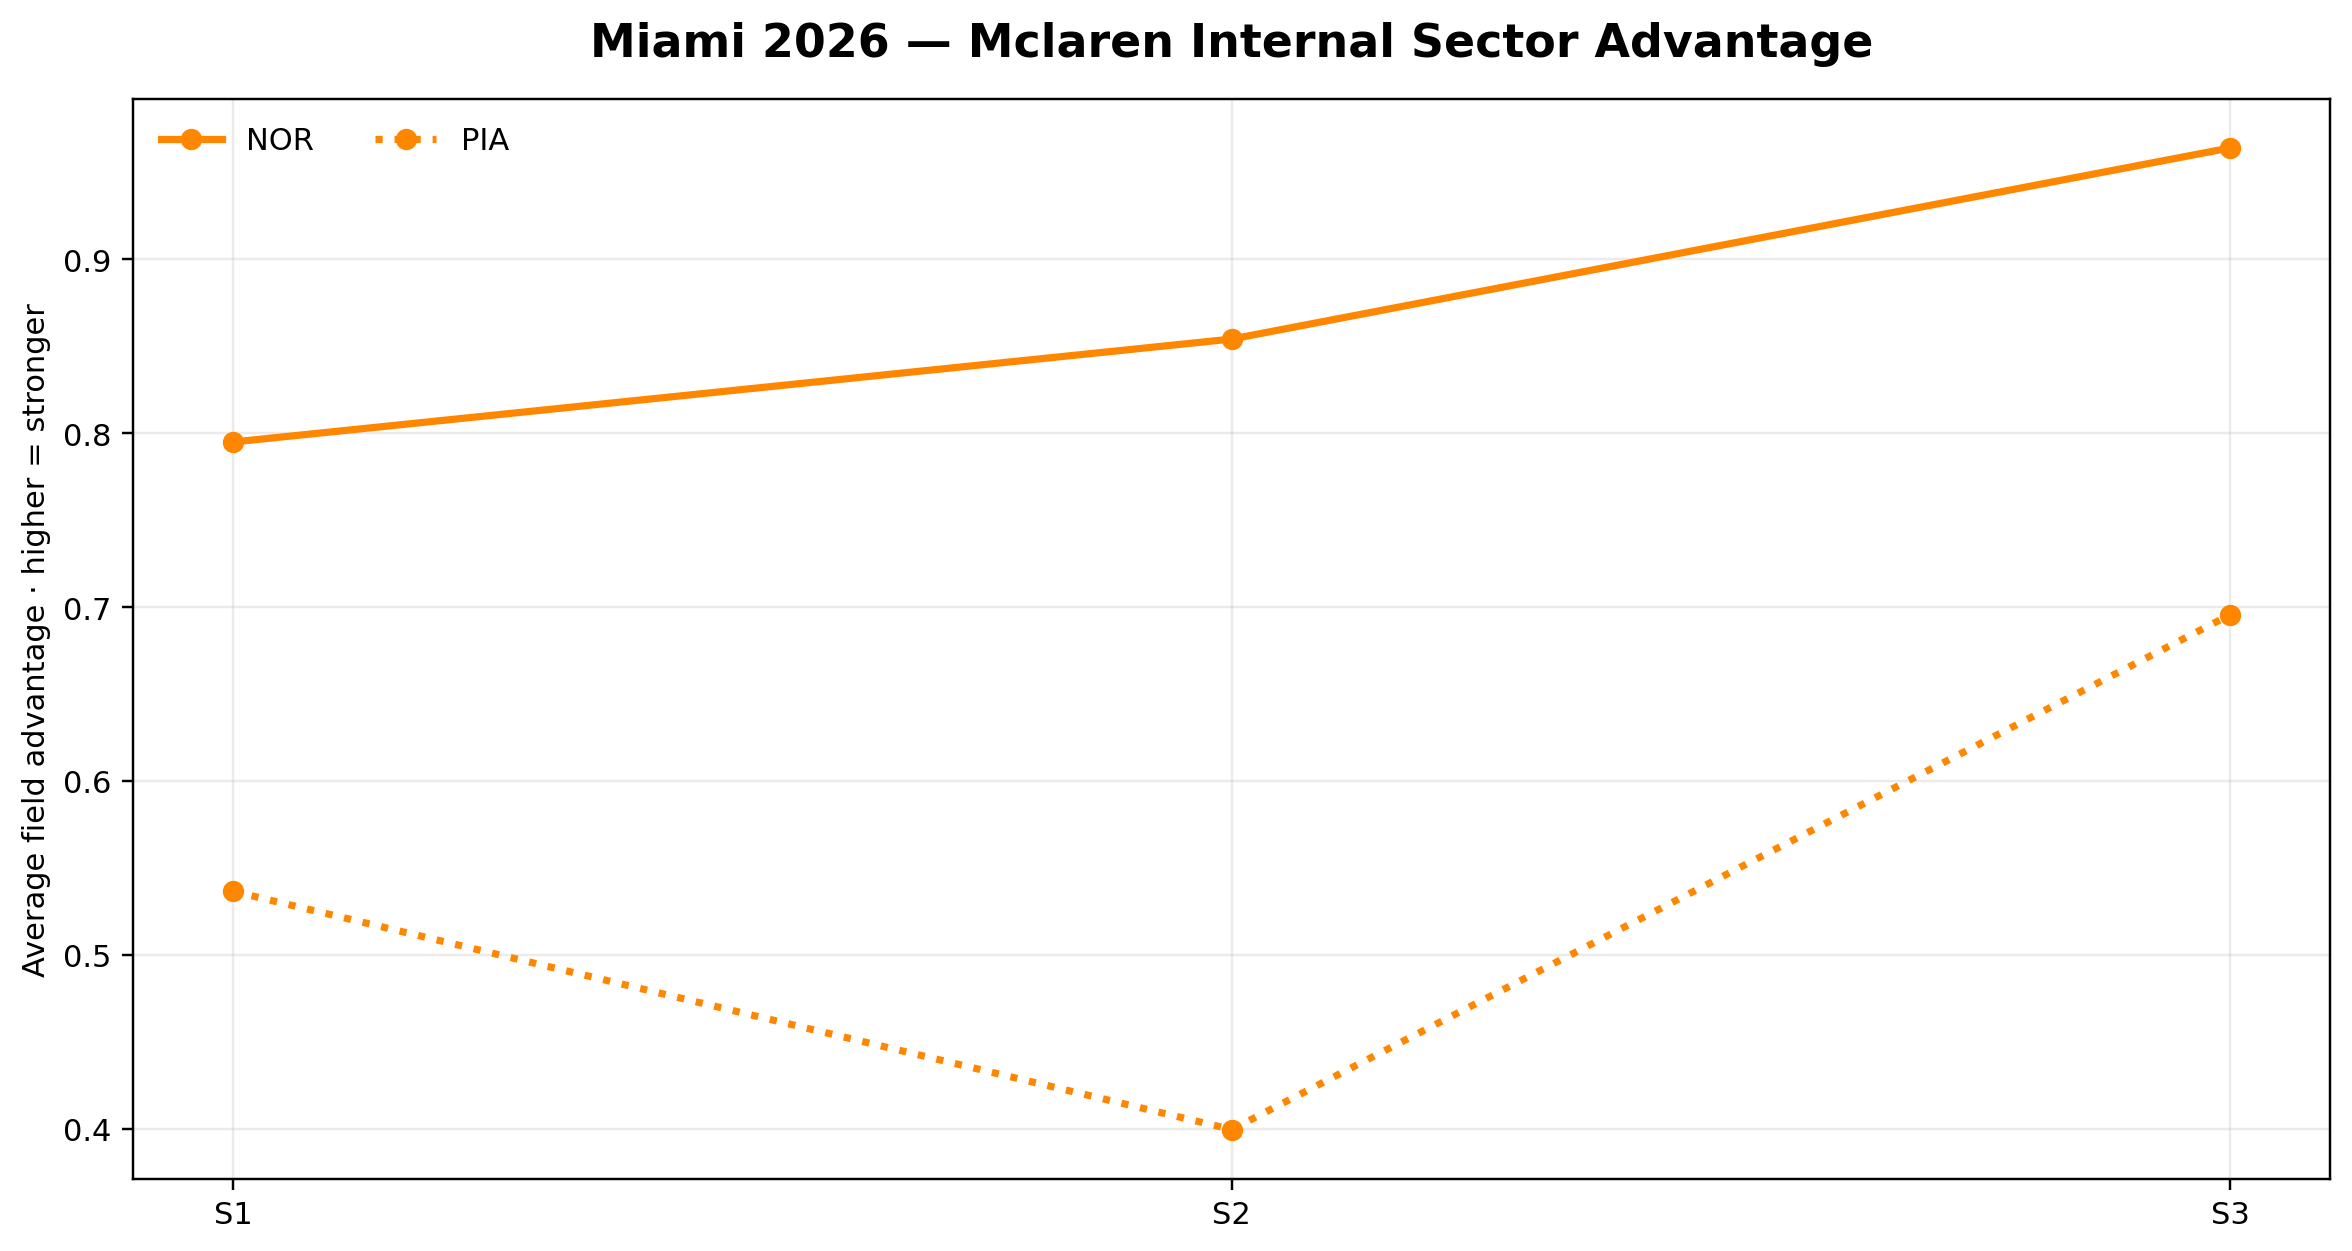
McLaren Internal Sector Advantage
NOR solid · PIA dotted
Open PDF
McLaren Internal Sector Advantage
McLaren’s Miami strength is not isolated to one phase. Norris owns the stronger S1/S3 profile, while Piastri remains close enough to confirm a genuine team-level race-state layer.
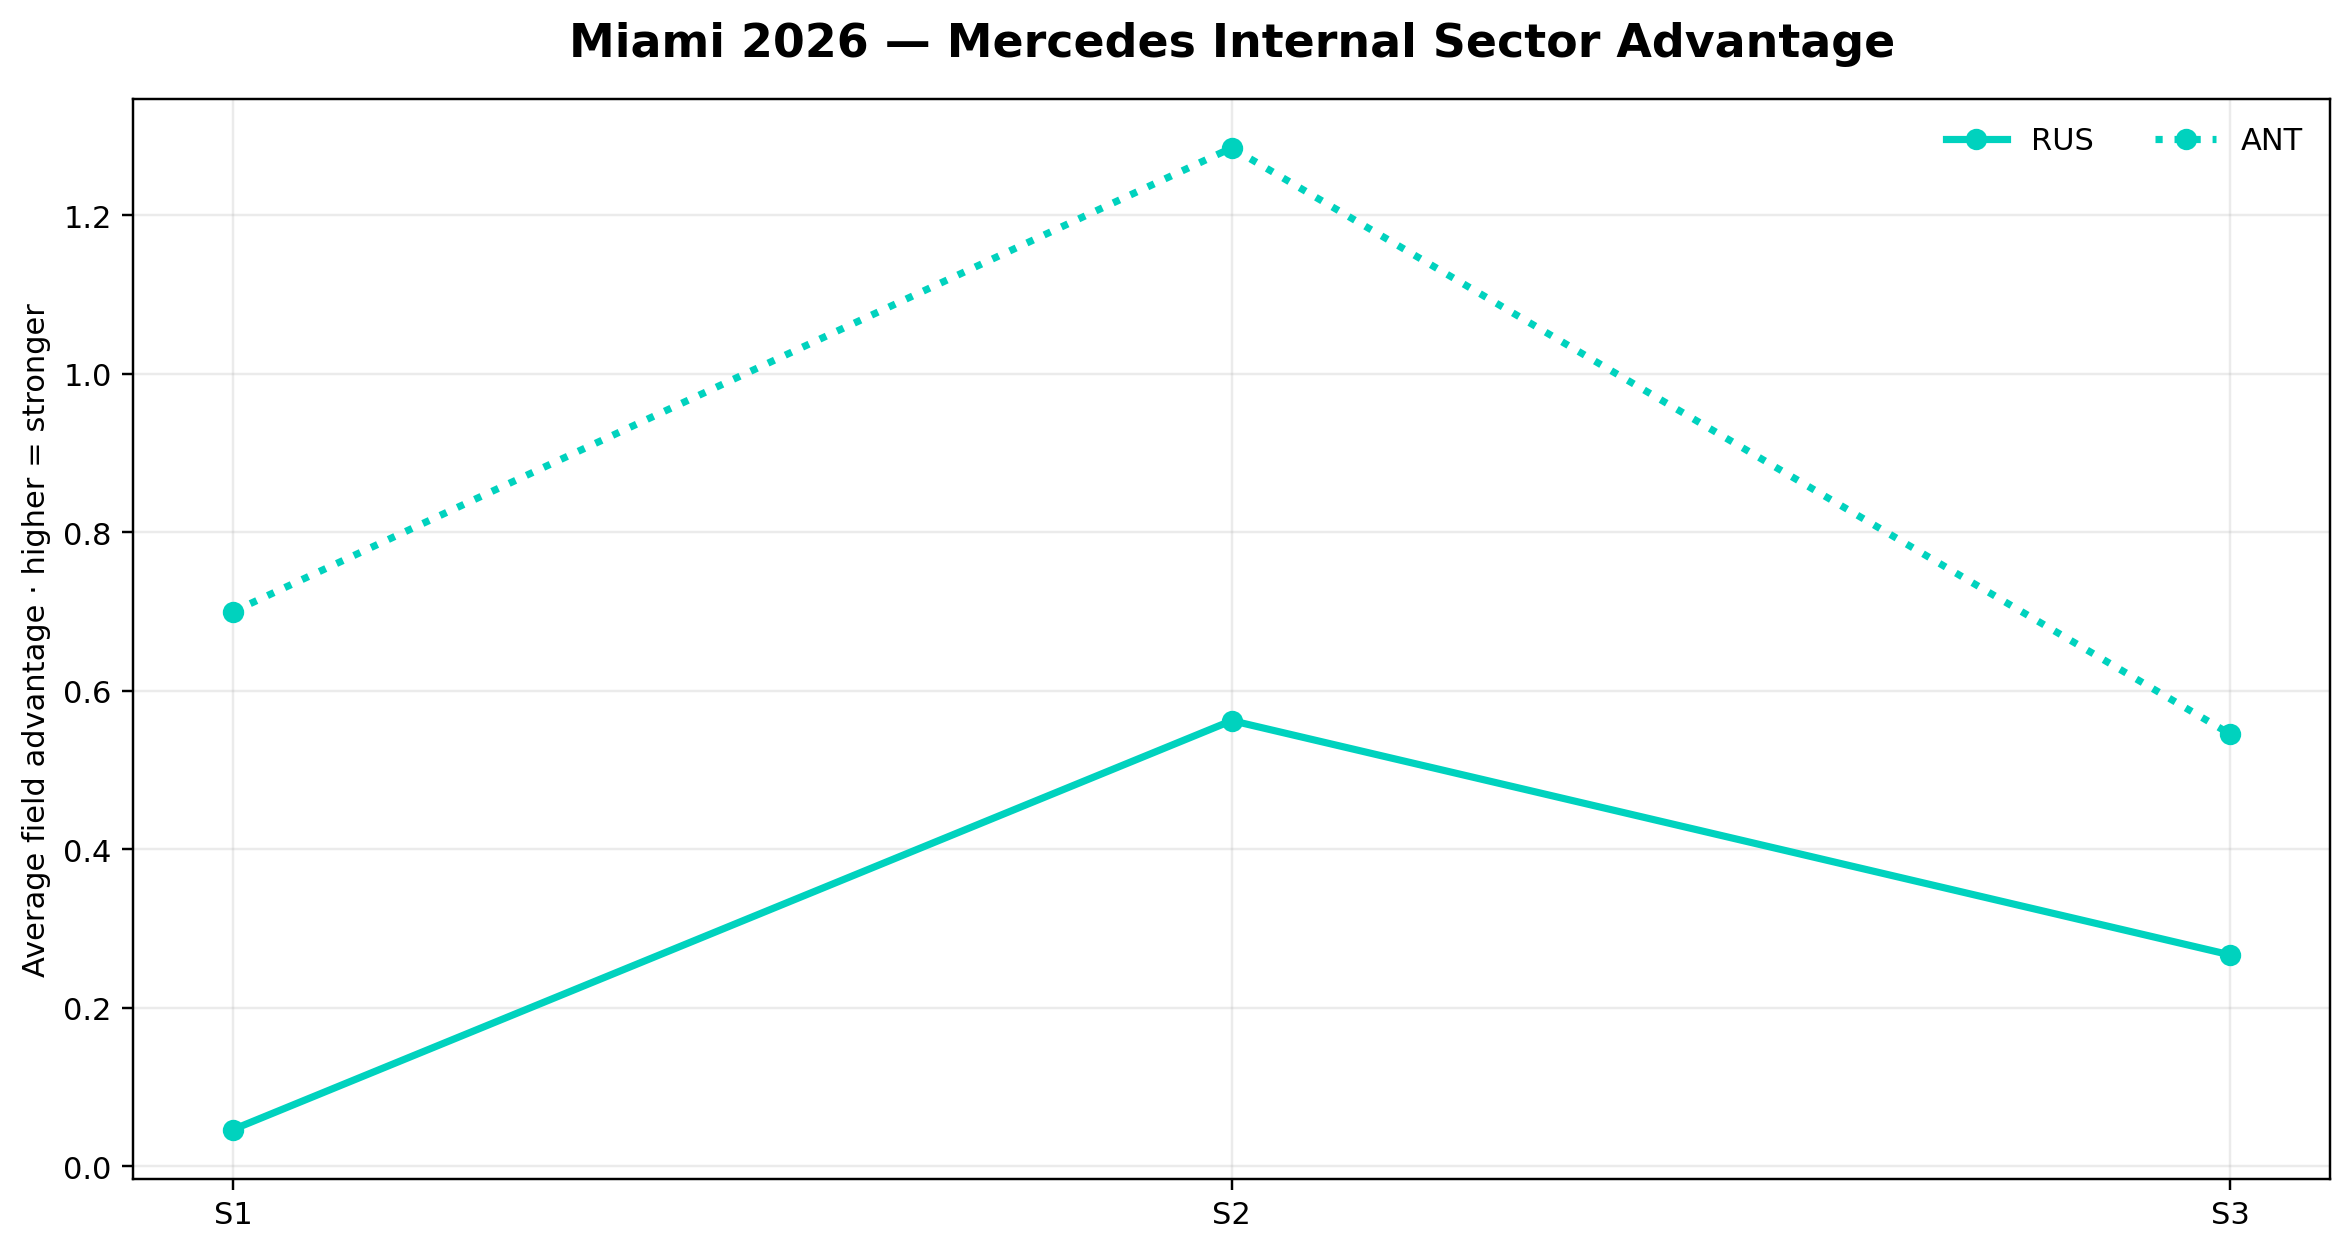
Mercedes Internal Sector Advantage
RUS solid · ANT dotted
Open PDF
Mercedes Internal Sector Advantage
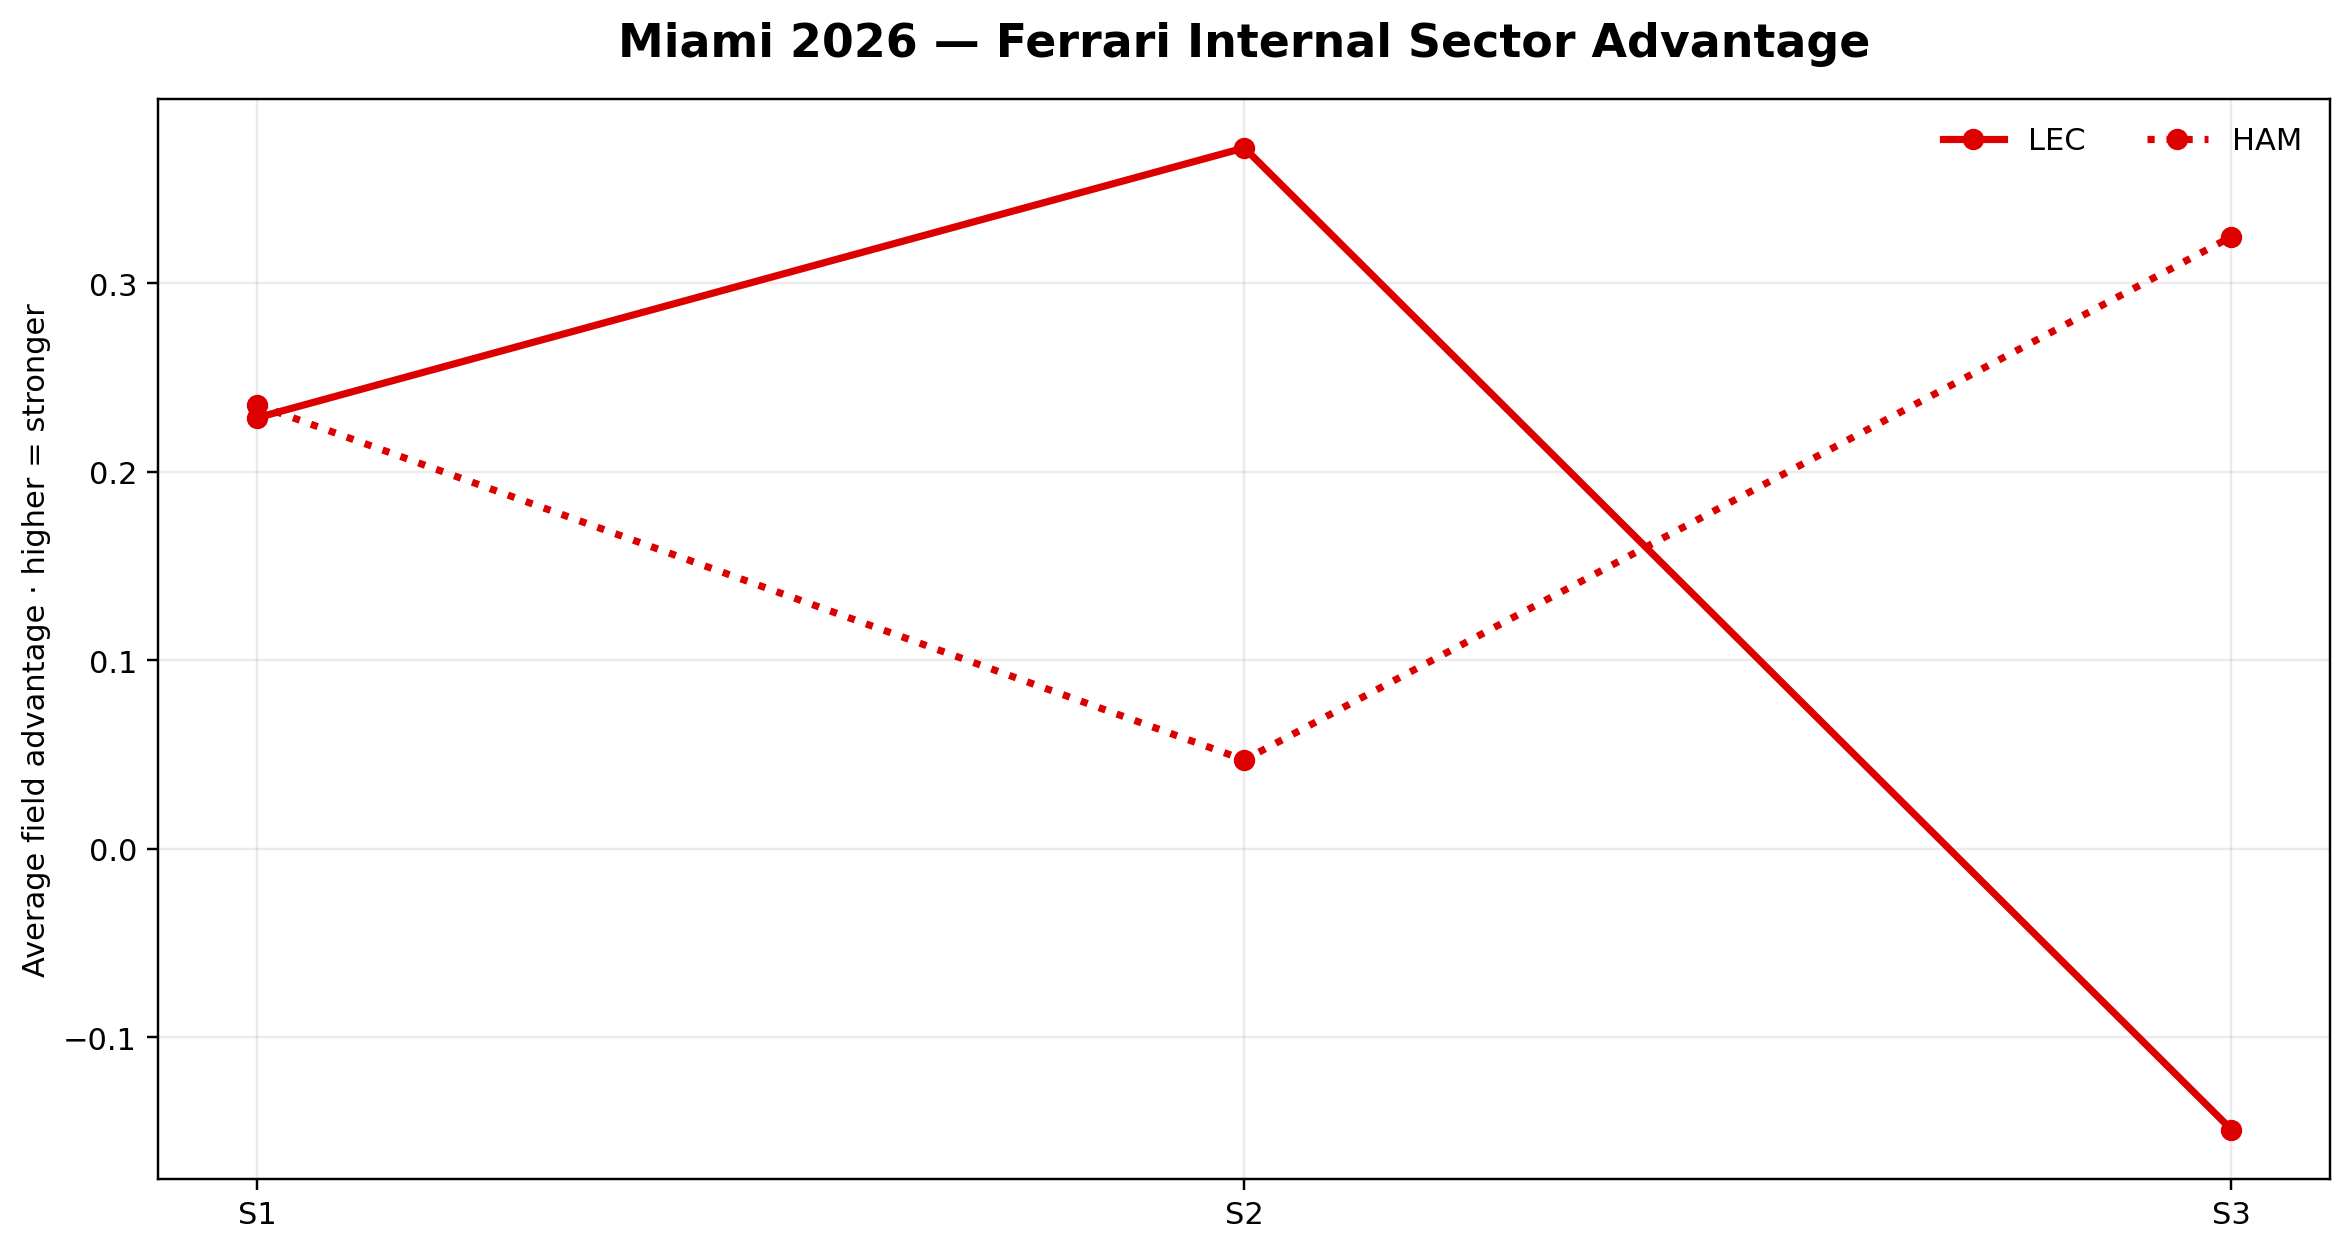
Ferrari Internal Sector Advantage
LEC solid · HAM dotted
Open PDF
Ferrari Internal Sector Advantage
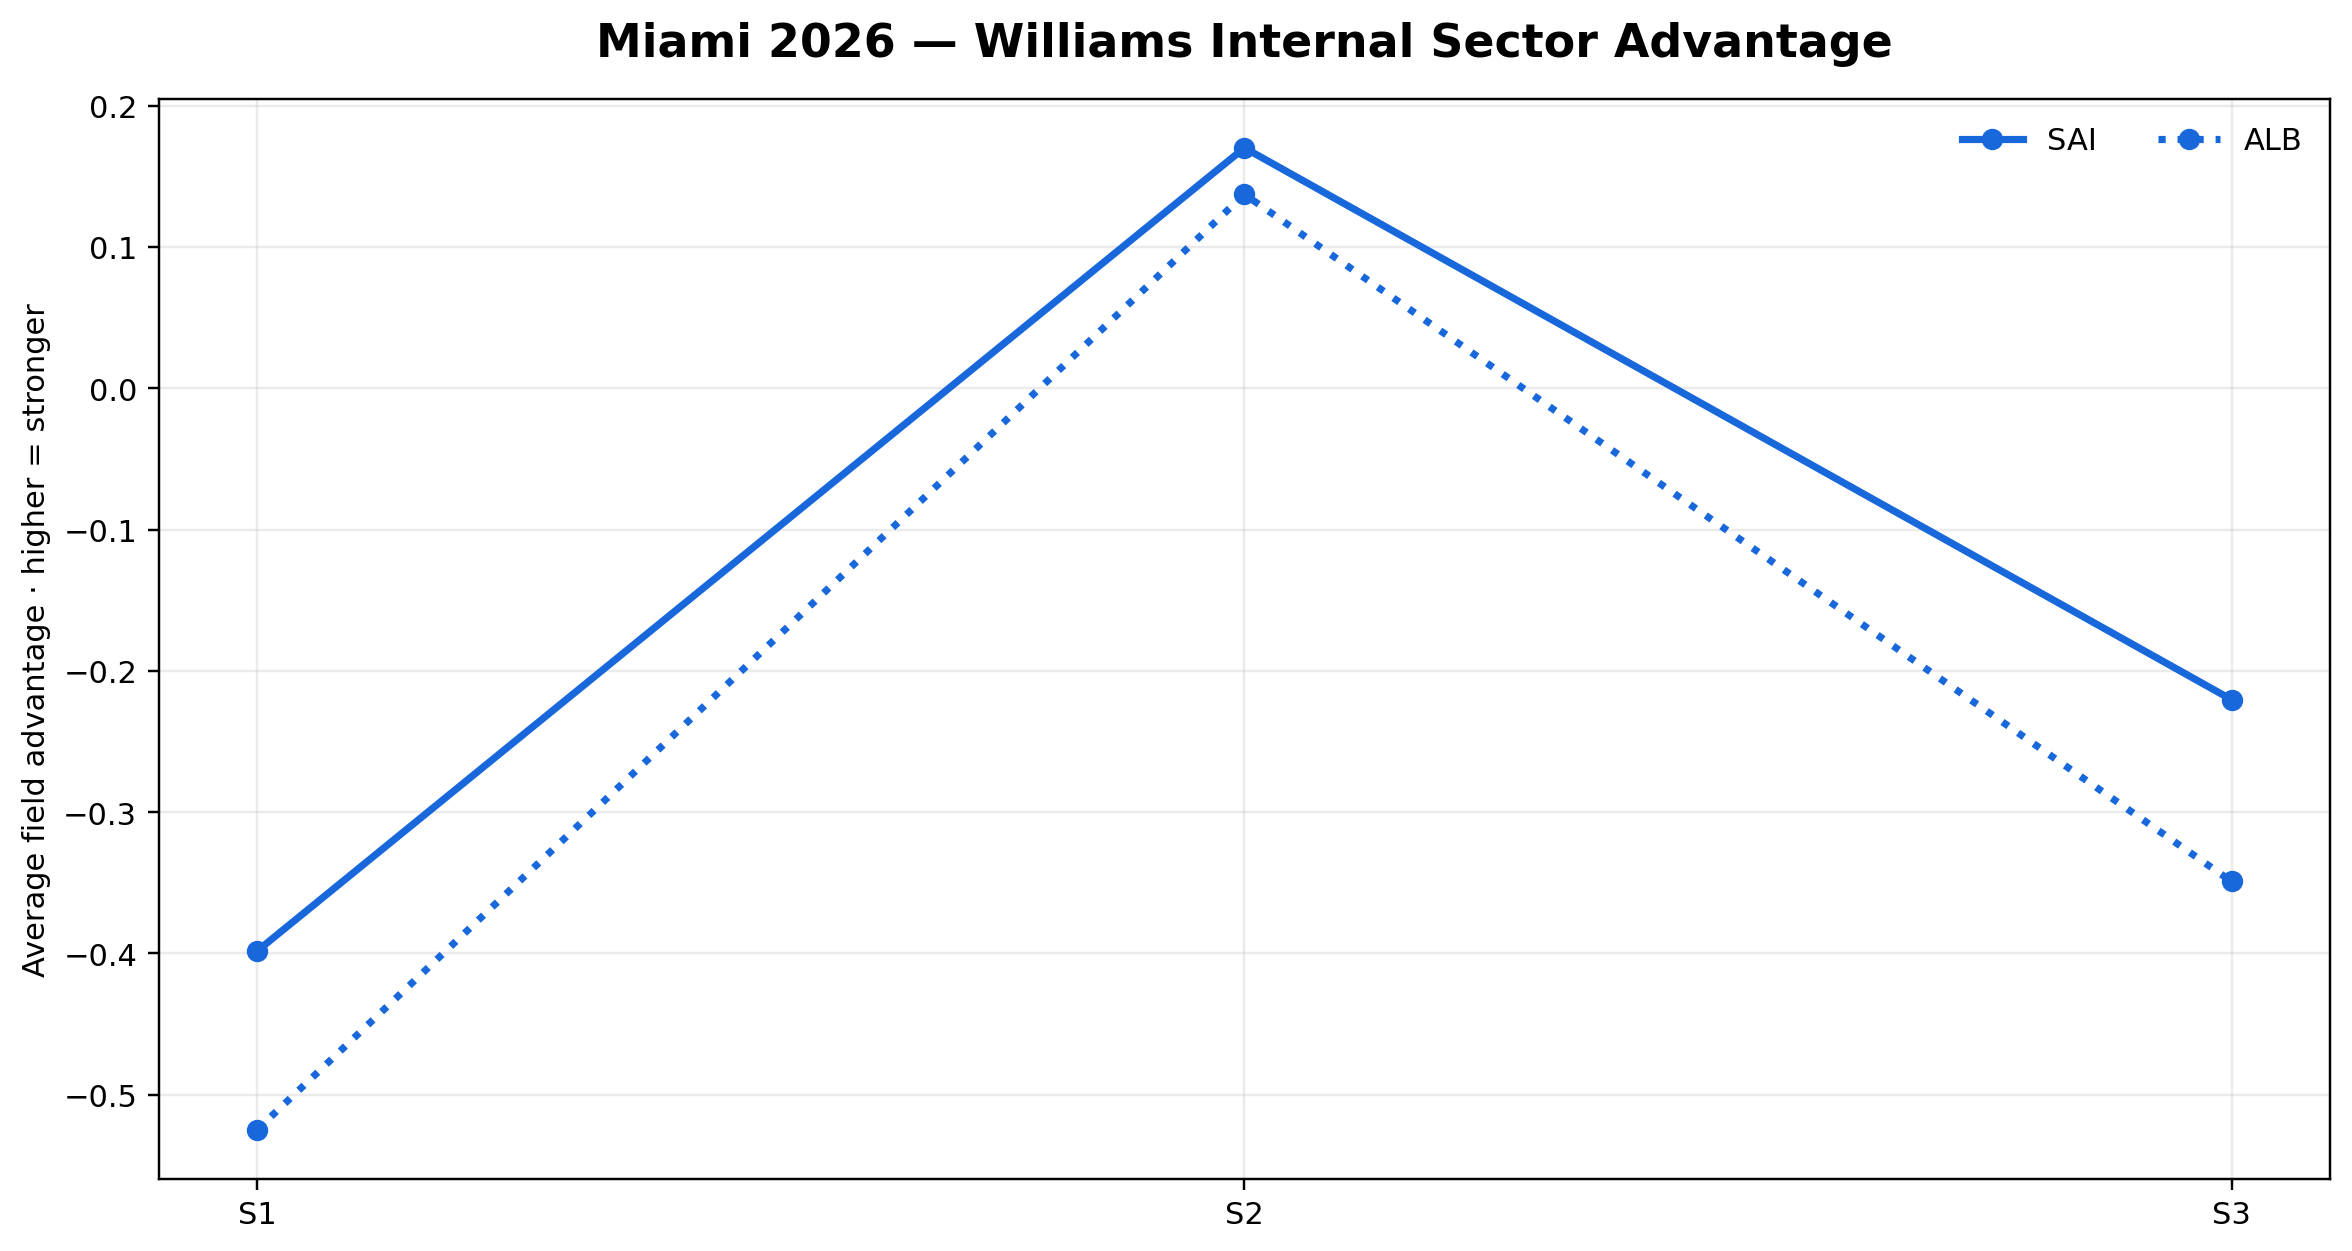
Williams Internal Sector Advantage
SAI solid · ALB dotted
Open PDF
Williams Internal Sector Advantage
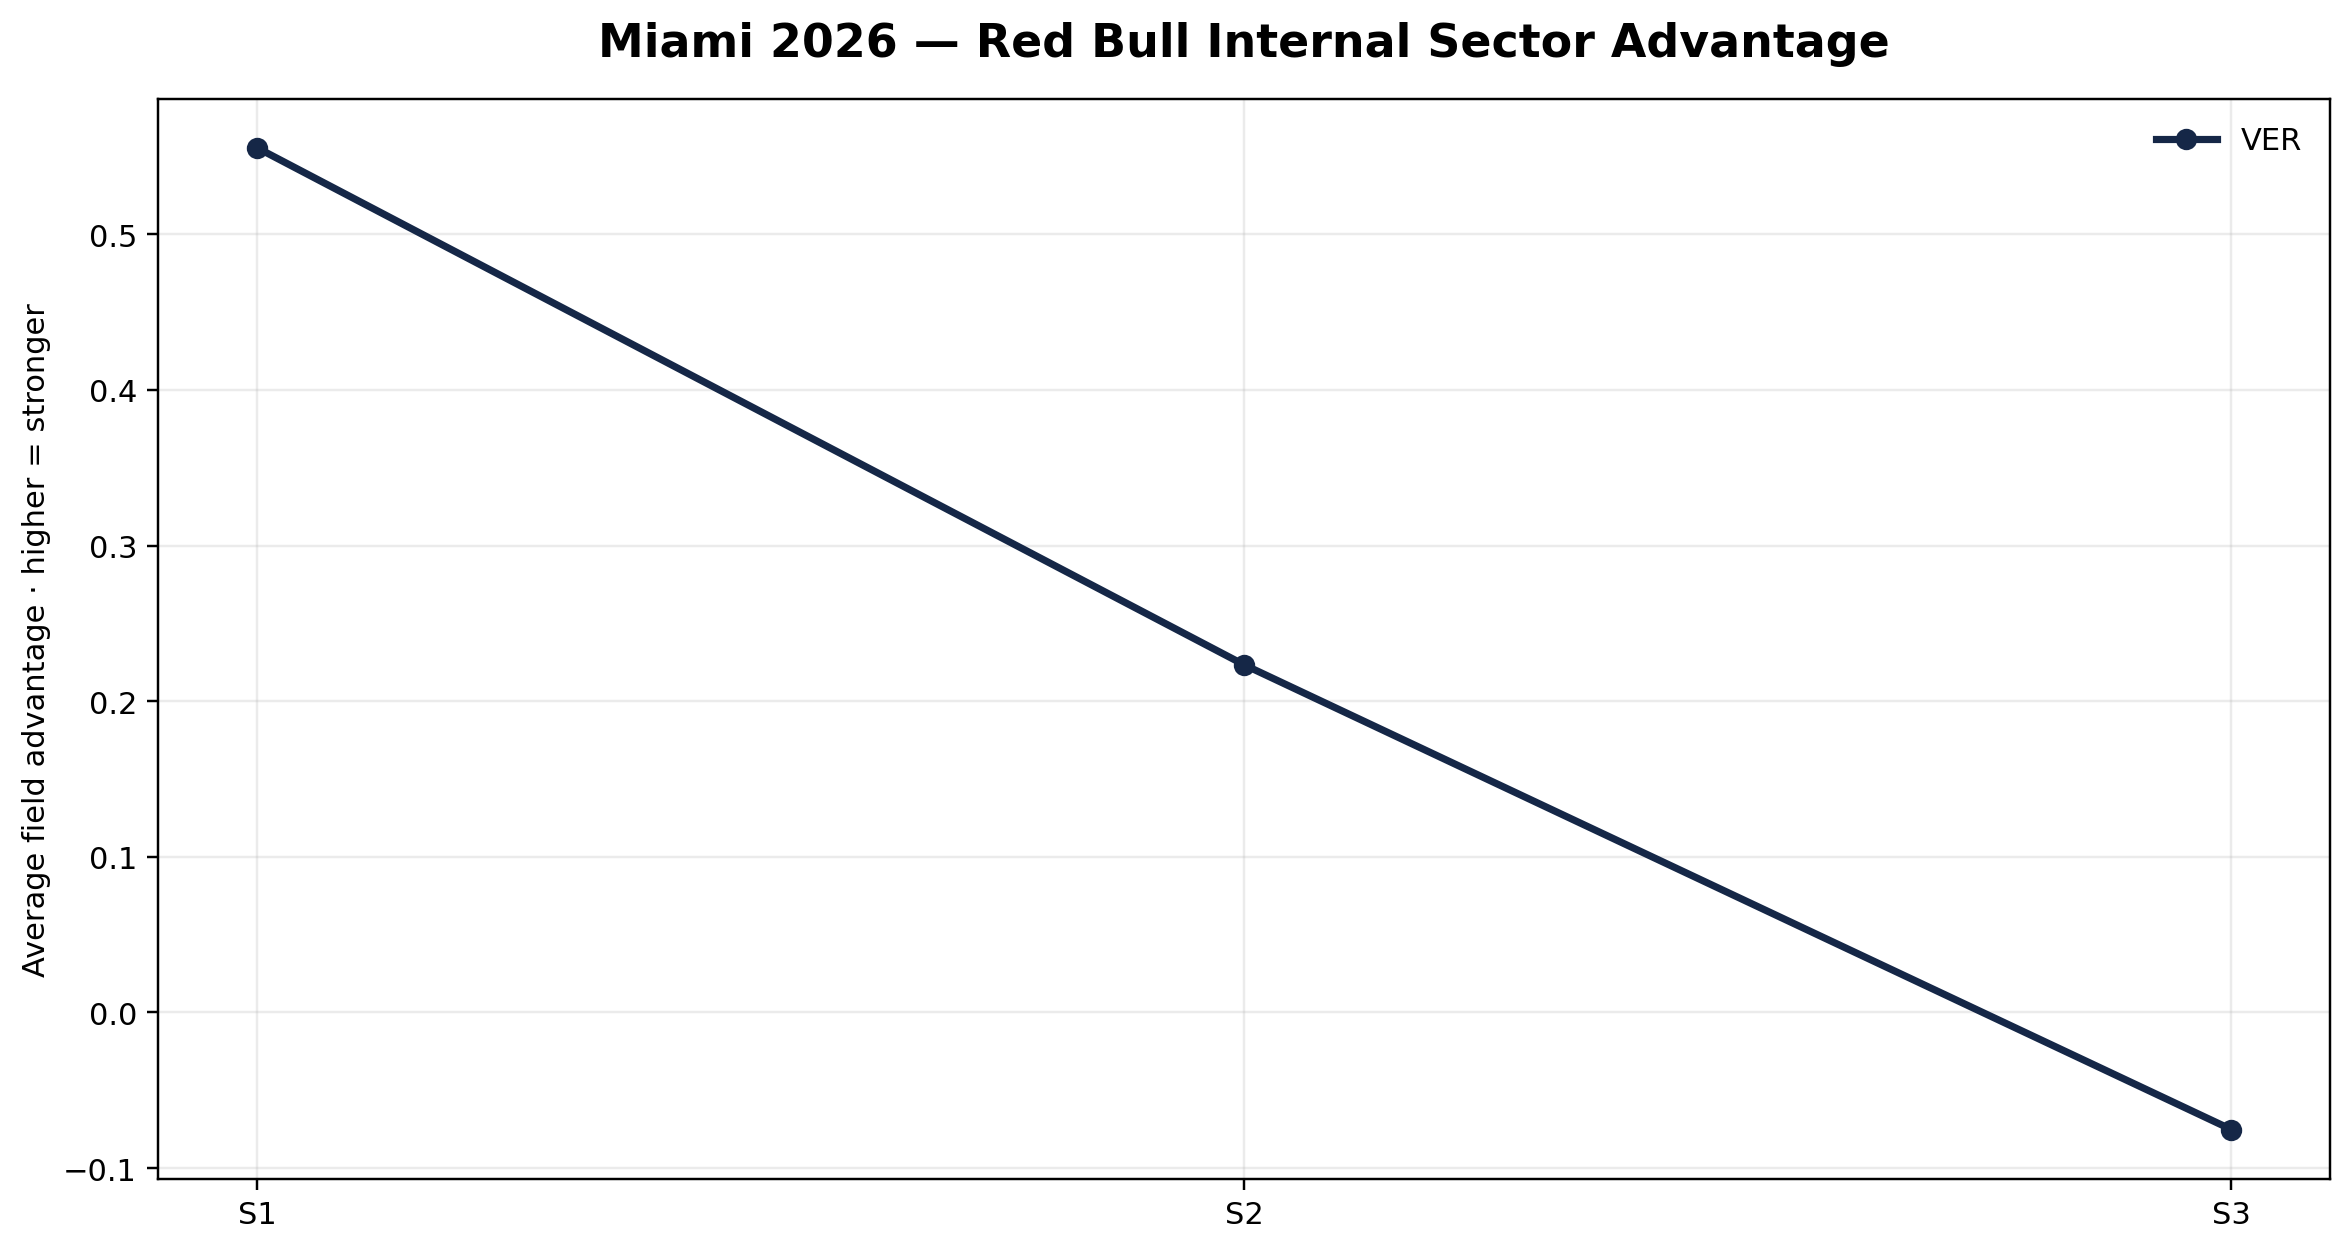
Red Bull Internal Sector Advantage
VER solid · HAD dotted · limited sample
Open PDF
Red Bull Internal Sector Advantage
Hadjar’s Miami sample is limited by early retirement, so the Red Bull internal sector profile is included as a partial read.
Miami after Japan
Japan and Miami express different field structures. Japan is an Antonelli control case. Miami is different: Norris leads the full-race structural table, while Antonelli holds the strongest S2 control phase and converts the visible race outcome through execution and position. QEIv18™ separates race outcome from underlying race-state dominance: some wins are control wins, while others are conversion wins.