Neoamorfic™ Racing Intelligence
Structural race intelligence, derived from physics.
Neoamorfic™ applies QEIv18™ to the 2026 Formula 1 season to extract structural race intelligence and build performance and decision systems. By comparing selected and analysed race data across the season, the framework identifies the underlying performance architecture of the grid: which drivers control the field, which remain stable under pressure, and where visible race outcome diverges from structural race reality.
Built on QEIv18™ by NeoAmorfic™. This site is part of the NeoAmorfic™ intelligence ecosystem and links structural race intelligence back to the core physics-native system.
2026 QEIv18™ Championship
Season-wide ranking of driver performance architecture, derived from field control, stability, peak capability, and competitive conversion.
| Rank | Driver | Team | QEIv18™ score |
|---|---|---|---|
| 1 | ANT | Mercedes | 80.20 |
| 2 | RUS | Mercedes | 79.33 |
| 3 | HAM | Ferrari | 76.33 |
| 4 | NOR | McLaren | 72.58 |
| 5 | LEC | Ferrari | 70.92 |
| 6 | PIA | McLaren | 68.90 |
| 7 | GAS | Alpine | 63.46 |
| 8 | VER | Red Bull Racing | 63.25 |
| 9 | HAD | Red Bull Racing | 62.13 |
| 10 | BEA | Haas F1 Team | 61.79 |
Race and sector intelligence
QEIv18™ operates across season, race, and sector levels to expose underlying competitive structure.
Part of the NeoAmorfic™ ecosystem
Neoamorfic Racing is one application of the same QEIv18™ system that also powers AI governance, EEG analysis, and financial intelligence.
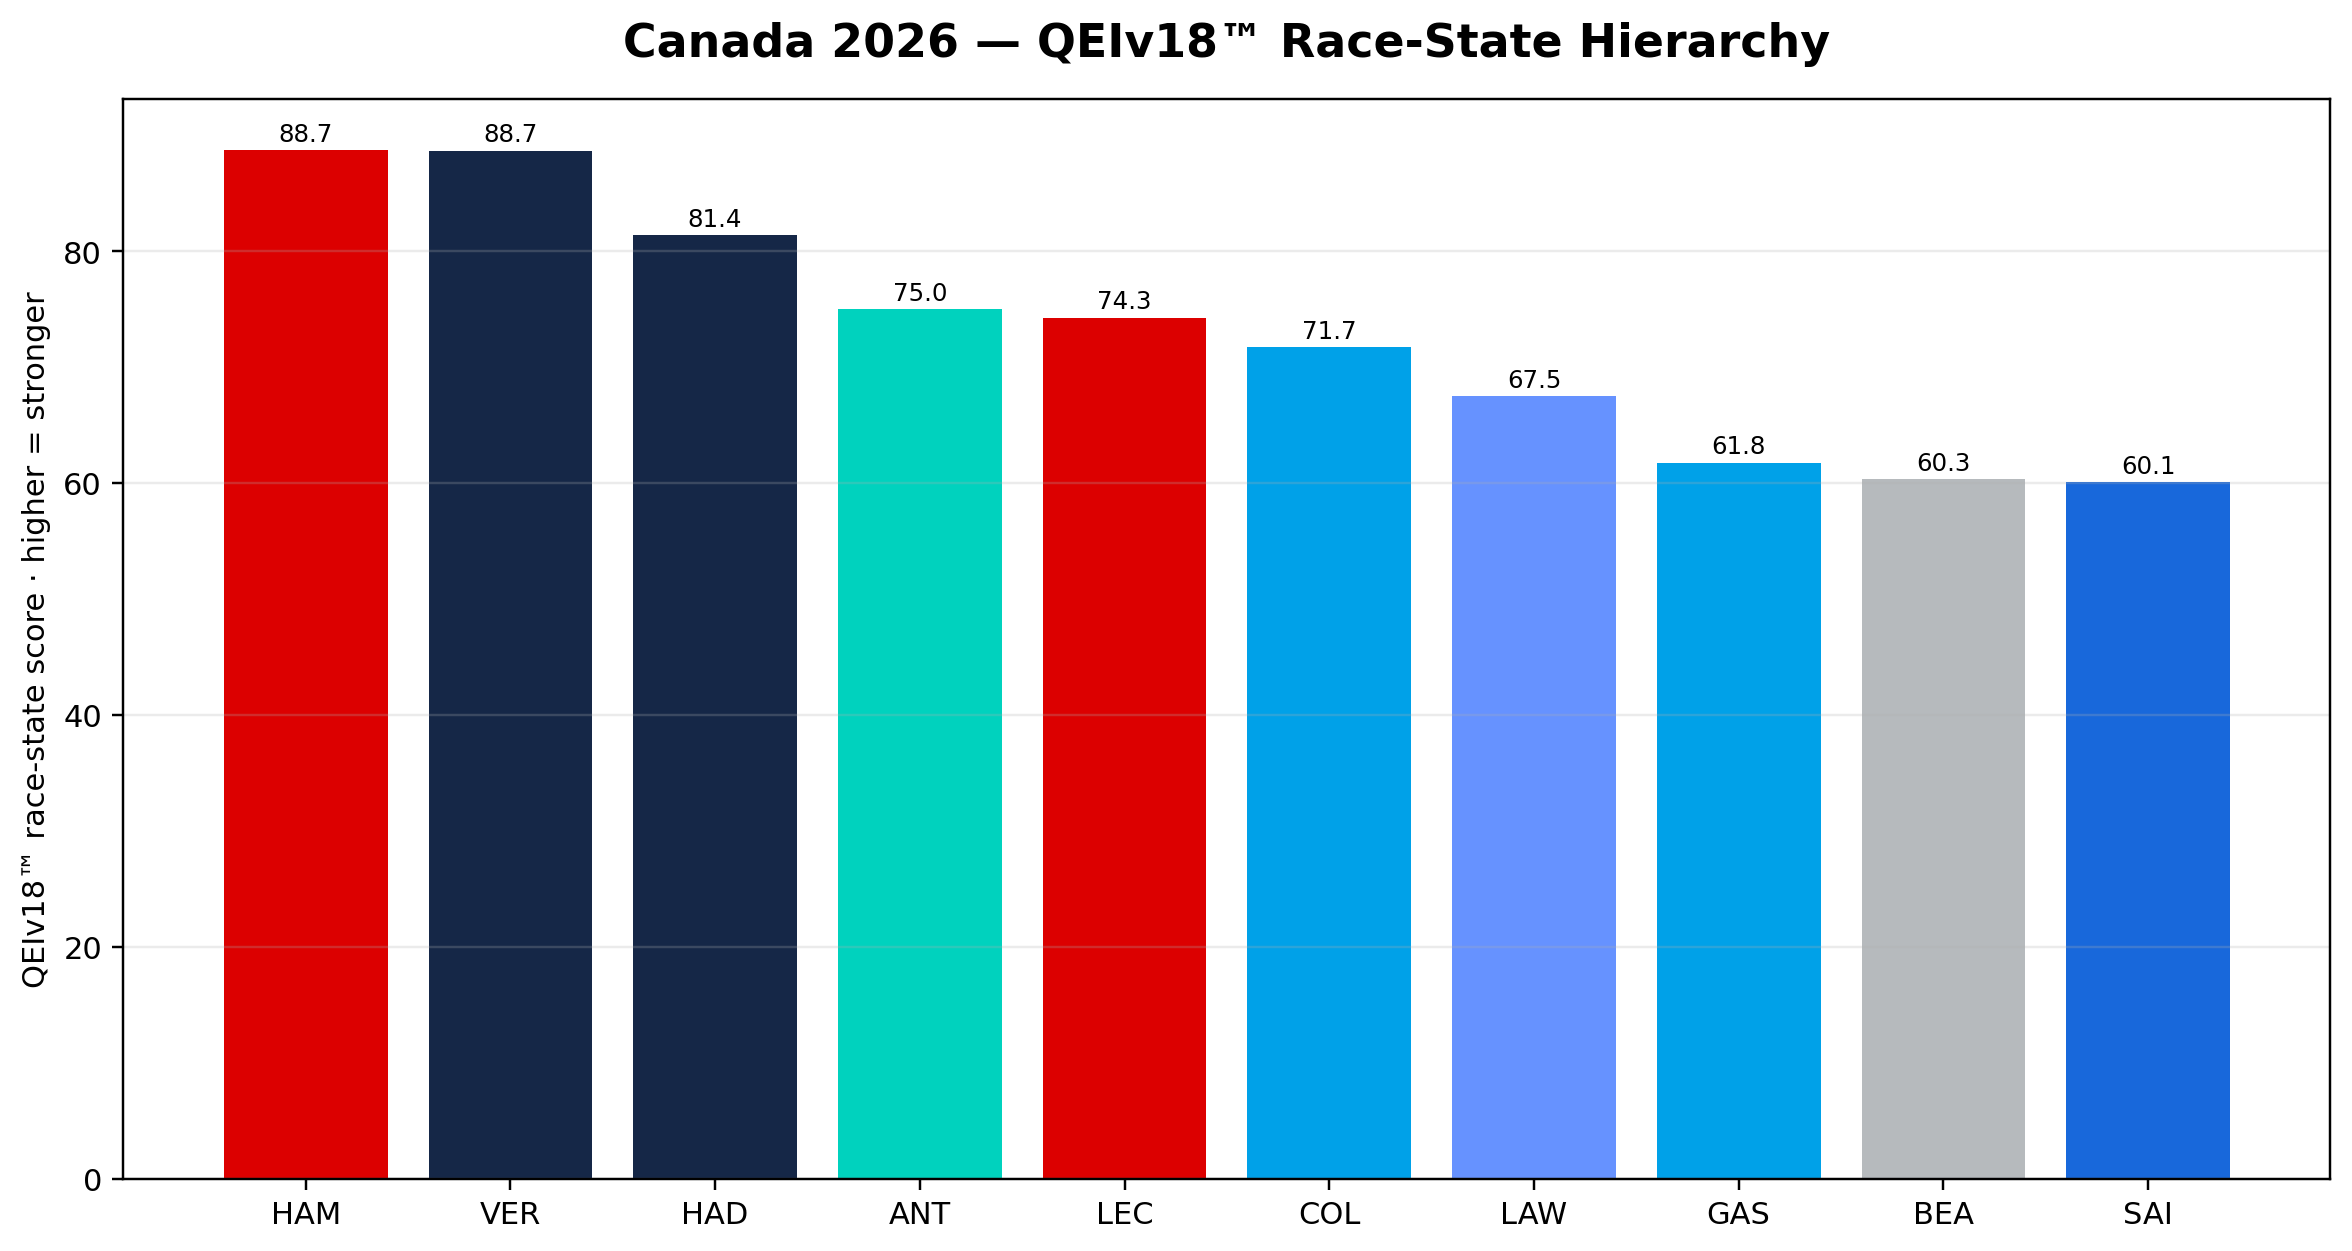
Canada 2026 Race Highlights
Canada reveals the difference between raw structural control and clean event conversion. Antonelli carries the strongest field-control signature, while Hamilton and Verstappen convert the event score more cleanly and Hadjar confirms Red Bull depth.
| Layer | Canada signal | Number |
|---|---|---|
| Structural Control | Antonelli strongest raw control layer | 0.657 · avg ordering 2.92 |
| Event Conversion | Hamilton and Verstappen nearly tied | HAM 88.70 · VER 88.67 |
| Emerging Threat | Hadjar closes on Antonelli at event-score level | HAD P3 · ANT P4 |
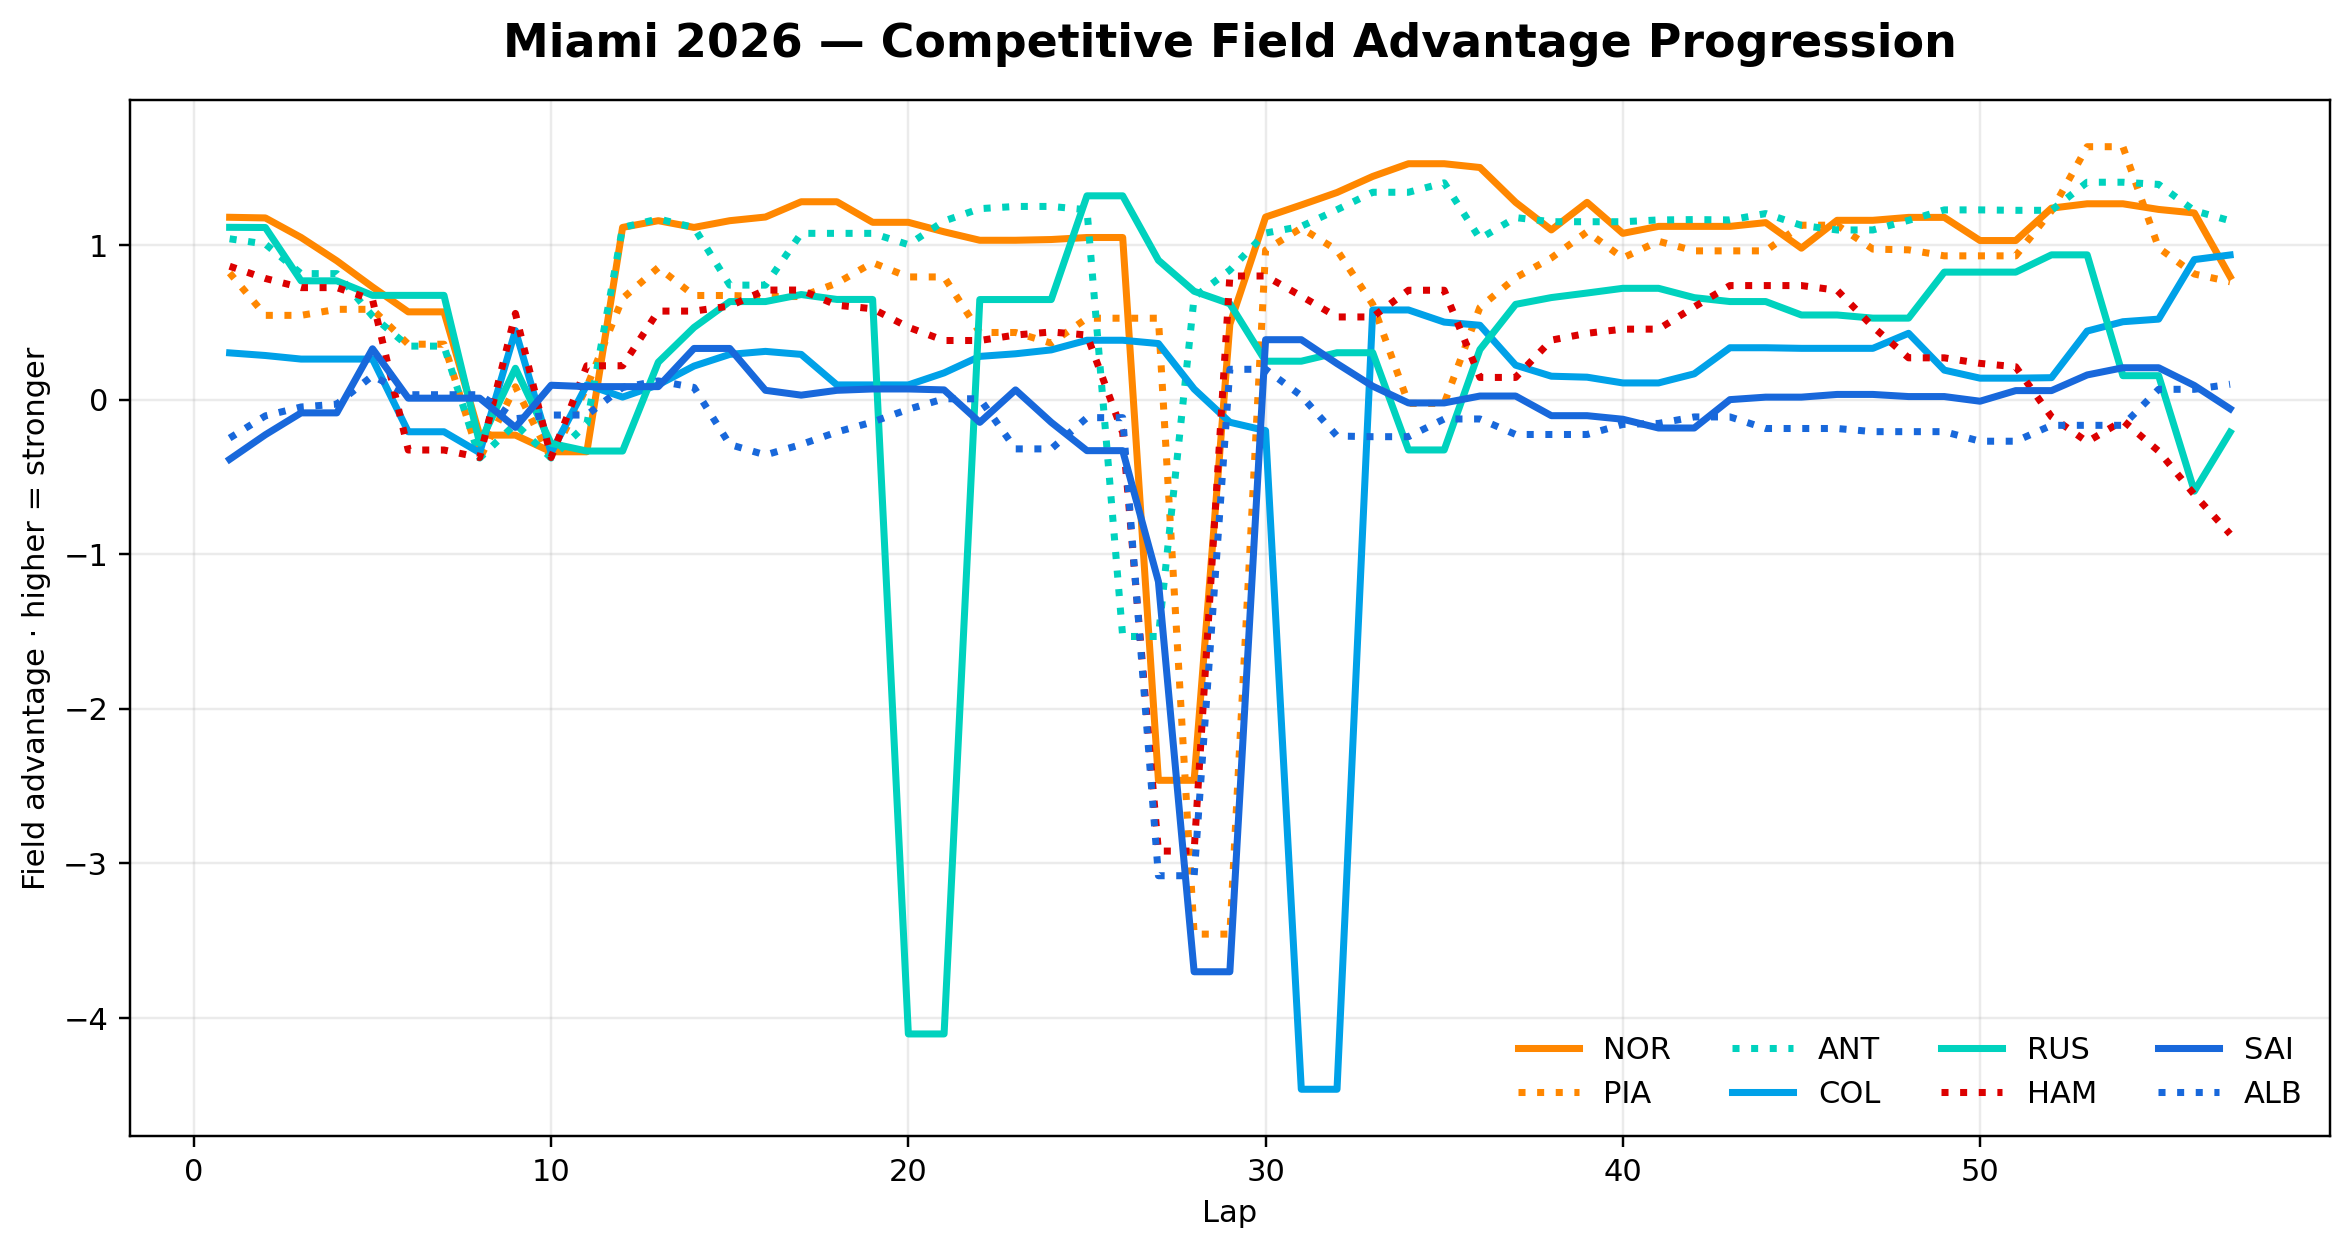
Miami 2026 Race Highlights
Miami separates structural race-state dominance from outcome conversion. Norris and McLaren led the full-race QEIv18™ field layer, while Antonelli converted the visible result through execution, position, and the strongest S2 control phase.
| Measure | Norris | Antonelli |
|---|---|---|
| QEIv18™ race score | 79.63 | 75.10 |
| Mean field advantage | 0.871 | 0.843 |
| Mean competitive ordering | 3.26 | 3.53 |
| Laps ahead by field advantage | 29 | 28 |
| Pit sequence | Lap 27 · 22.565s lane | Lap 26 · 22.128s lane |