Sector Advantage Map
We reveal where your opponent is structurally strong — without telemetry access.
Built on QEIv18™ by NeoAmorfic™. Sector intelligence decomposes race performance into segment-level structure to identify local competitive strength, asymmetry, and conversion opportunities.
Why it matters
Australia 2026 — sector leaders
Australia shows split sector leadership inside the leading Mercedes layer. Russell leads S1 and S2 structurally, while Antonelli leads S3. This is useful because it suggests internal asymmetry rather than a single uniform performance profile across the lap.
Avg sector rank: 3.49
Best sector laps: 22
Avg sector rank: 4.60
Best sector laps: 18
Avg sector rank: 3.29
Best sector laps: 24
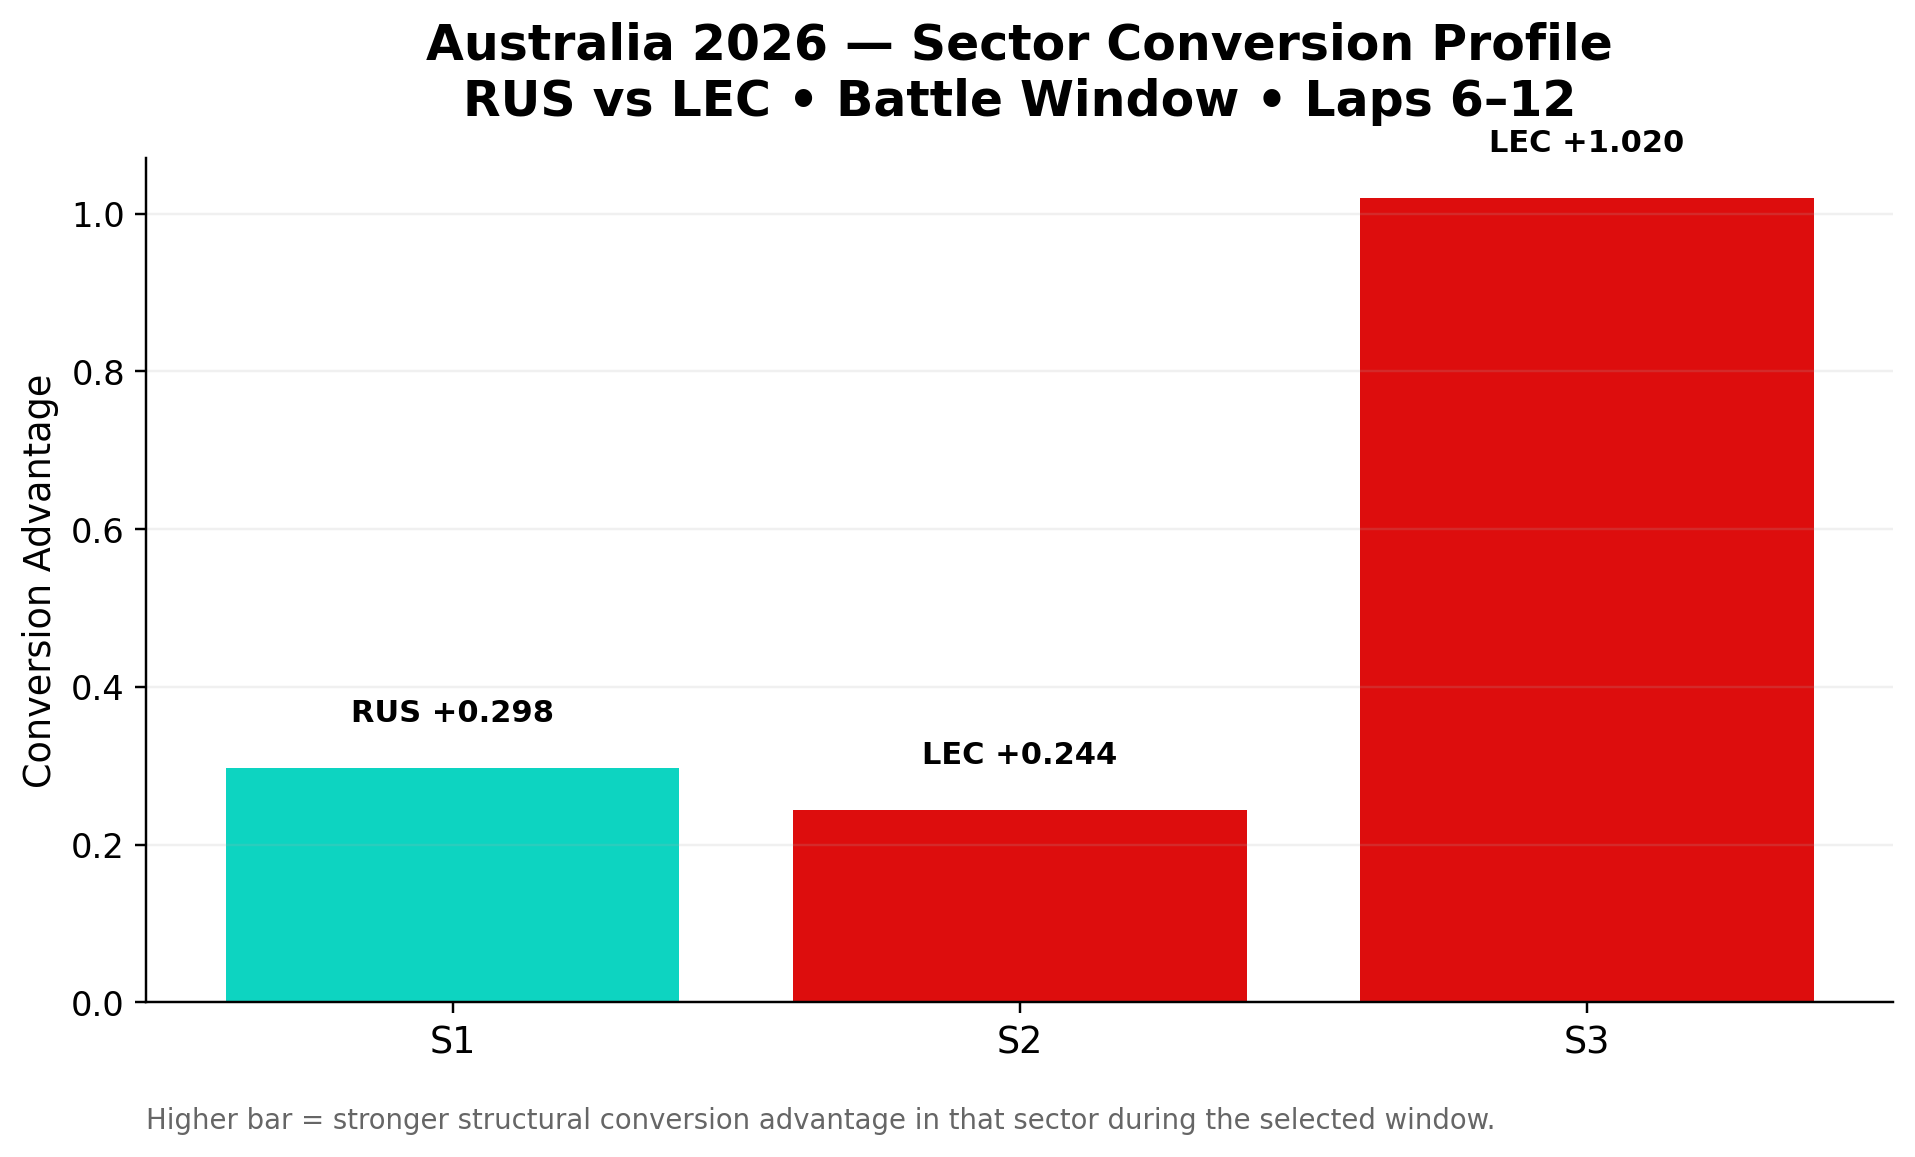
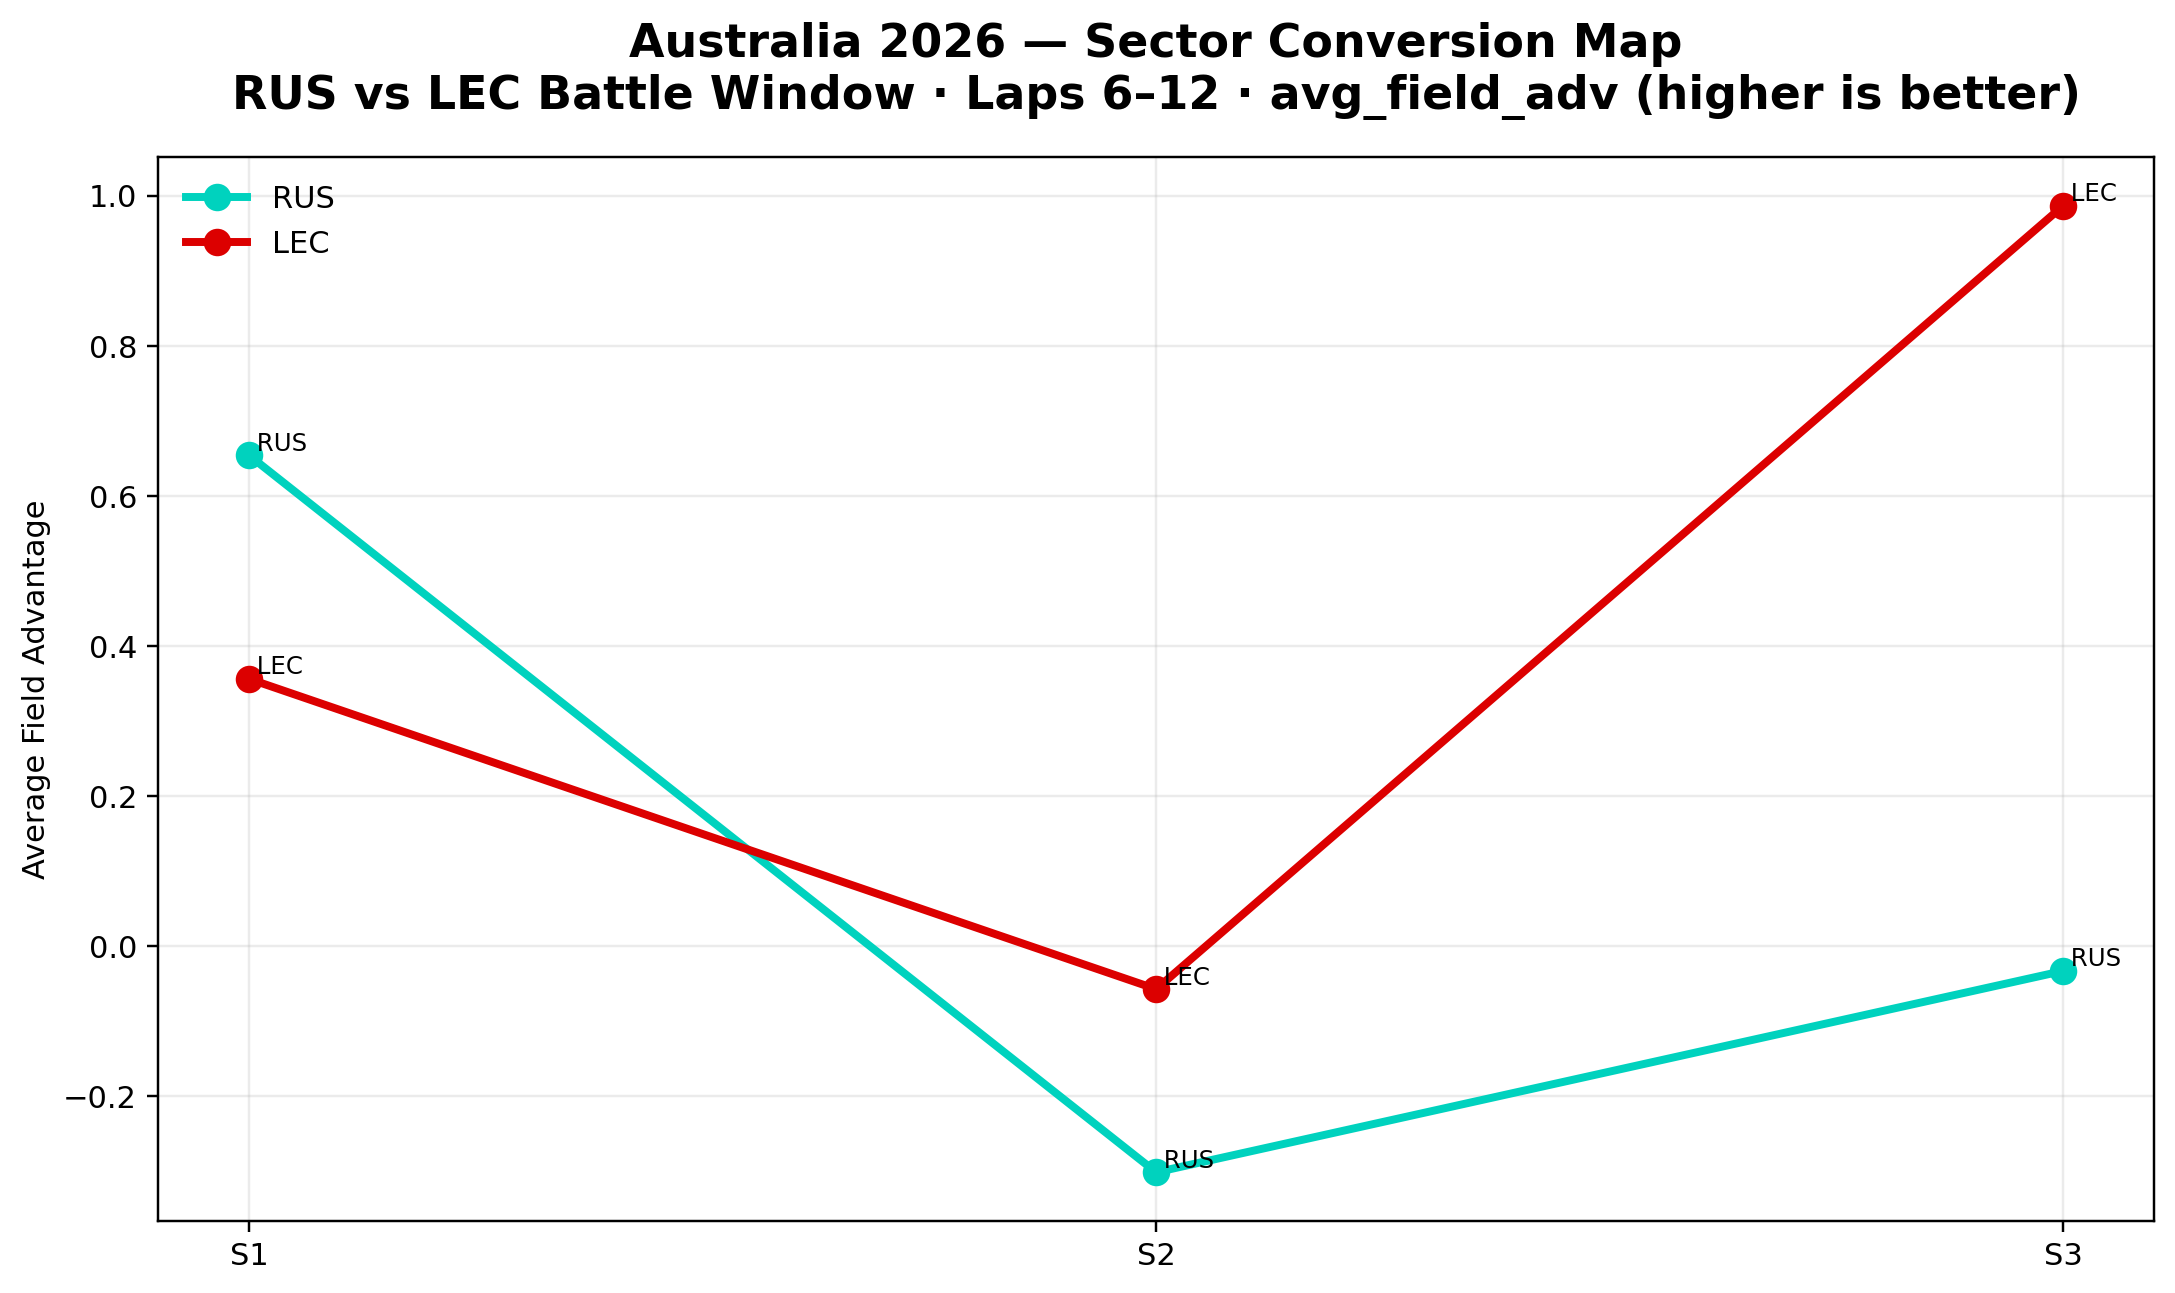
Australia 2026 — sector conversion case
The battle window between Russell and Leclerc shows how sector structure can explain outcome more clearly than the visible duel alone. Russell holds the stronger conversion profile in S1, but Leclerc gains the decisive structural edge later in the lap — especially in S3.
China 2026 — sector leaders
China provides another example of sector-level decomposition, showing where structural advantage concentrates across different parts of the lap.
Avg sector rank: 2.96
Best sector laps: 22
Avg sector rank: 2.20
Best sector laps: 28
Avg sector rank: 3.02
Best sector laps: 17
Japan 2026 — sector leaders
Japan sector analysis shows where the decisive competitive edge was created across the lap. QEIv18™ separates the circuit into structural segments and identifies where control, stability, and conversion were strongest.
Avg sector rank: 4.23
Best sector laps: 10
Avg sector rank: 3.04
Best sector laps: 20
Avg sector rank: 4.34
Best sector laps: 20
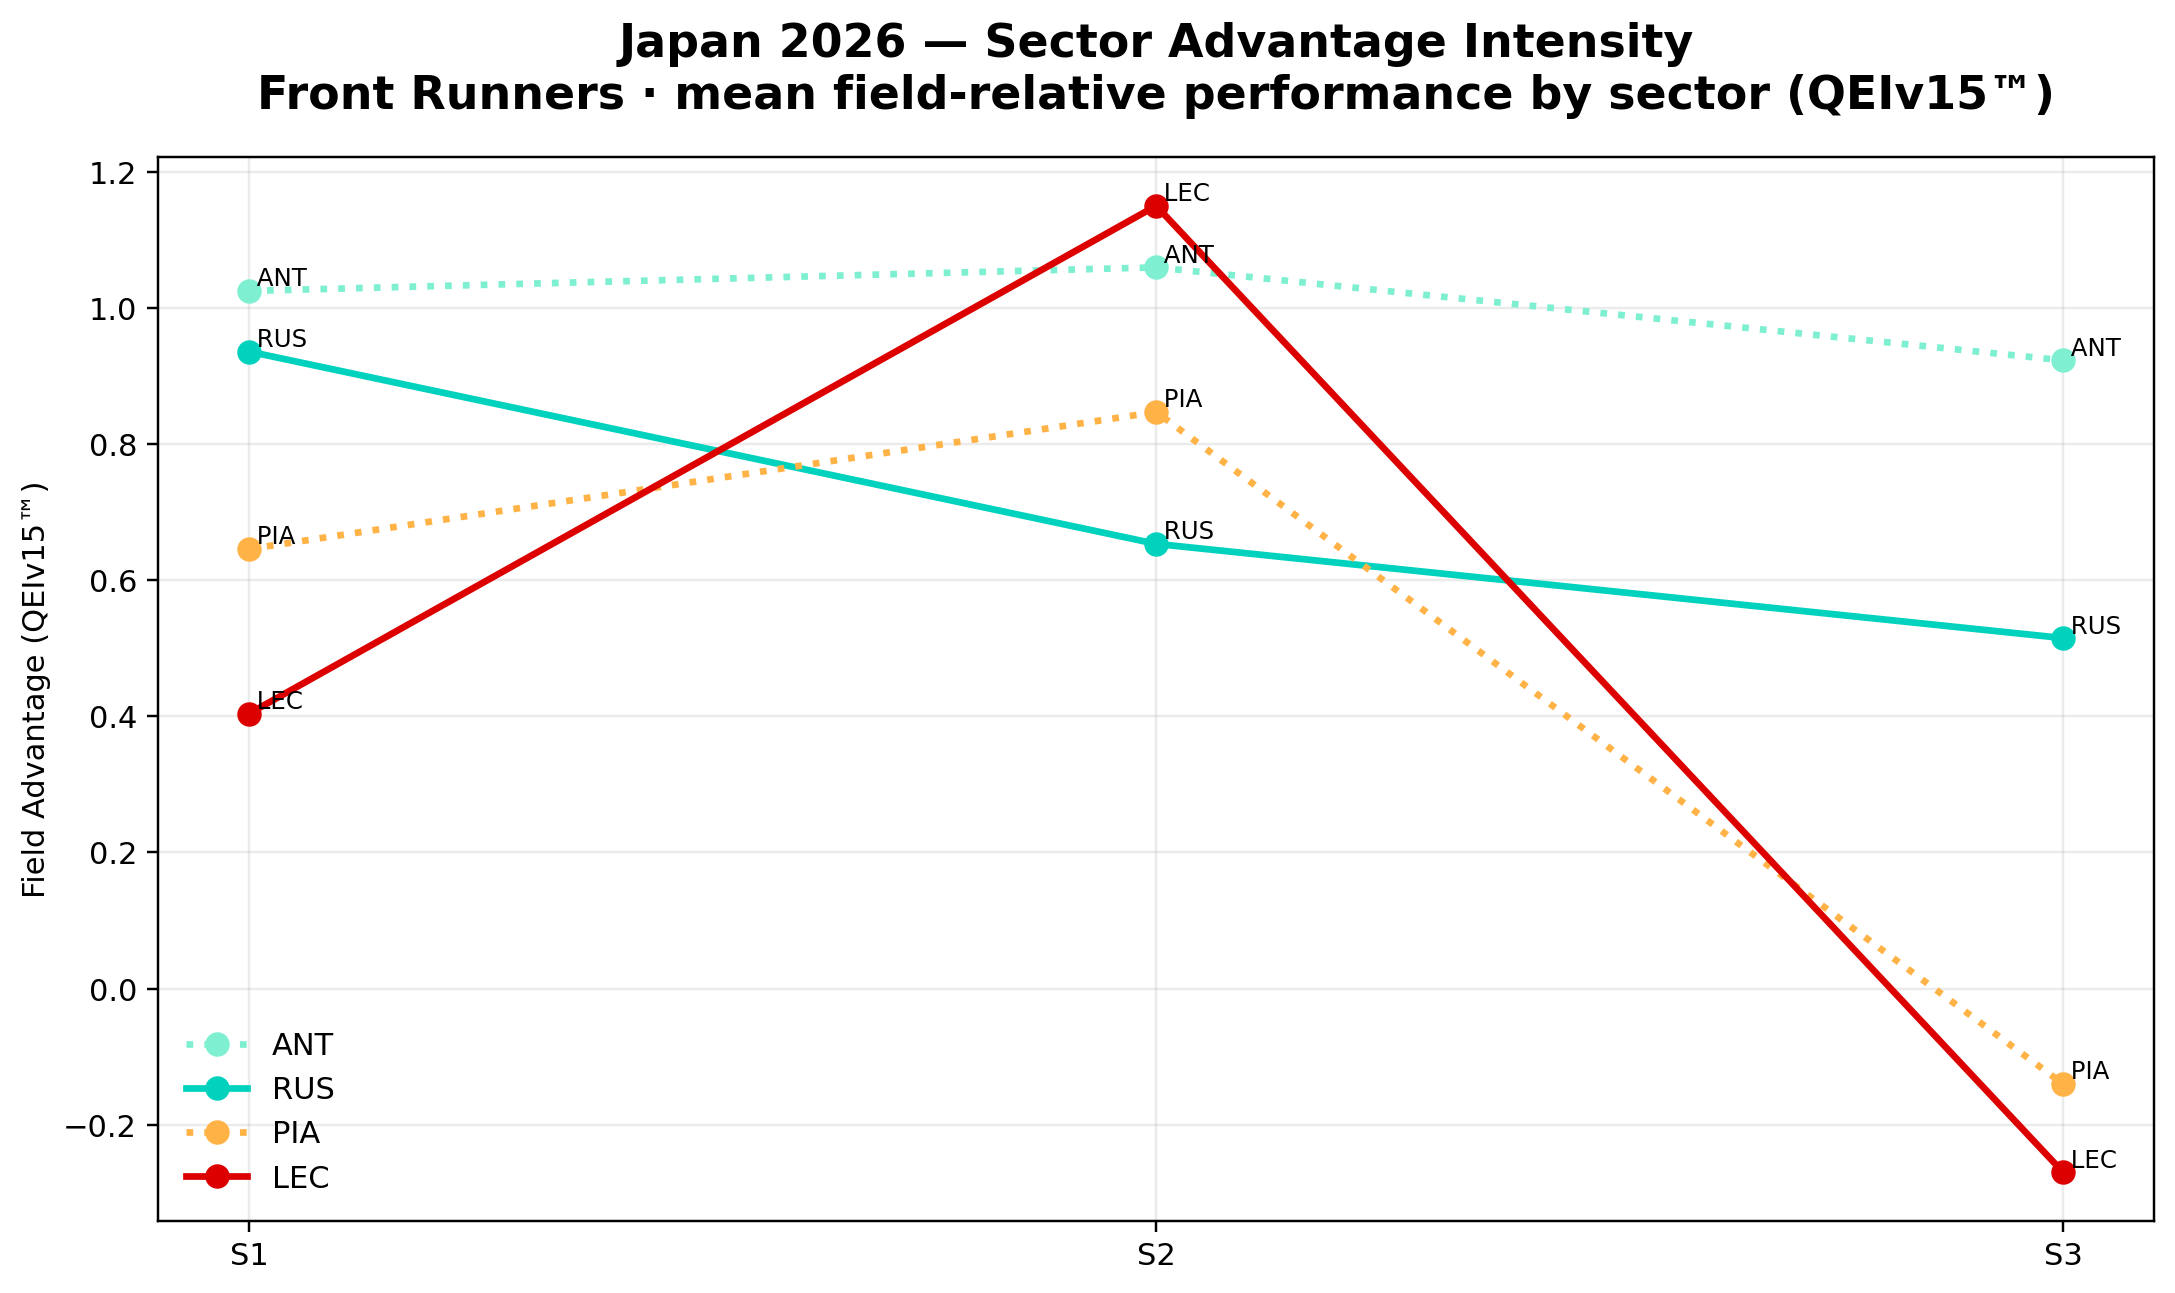
Japan 2026 — front-group sector maps
Sector structure in Japan shows divergence between frequency and magnitude of performance. In S1, PIA leads by average rank, indicating more frequent sector-level leadership. However, ANT records stronger mean field-relative advantage, indicating greater intensity when the sector edge is expressed. This distinction separates consistency of position from magnitude of control.
Japan 2026 — per-sector stability layer
The instability layer measures how much each driver’s sector ranking fluctuates lap to lap inside the front group. Lower variability indicates a more repeatable structural profile, while higher variability suggests less stable sector control.
Evaluated laps: 52
Evaluated laps: 53
Evaluated laps: 53
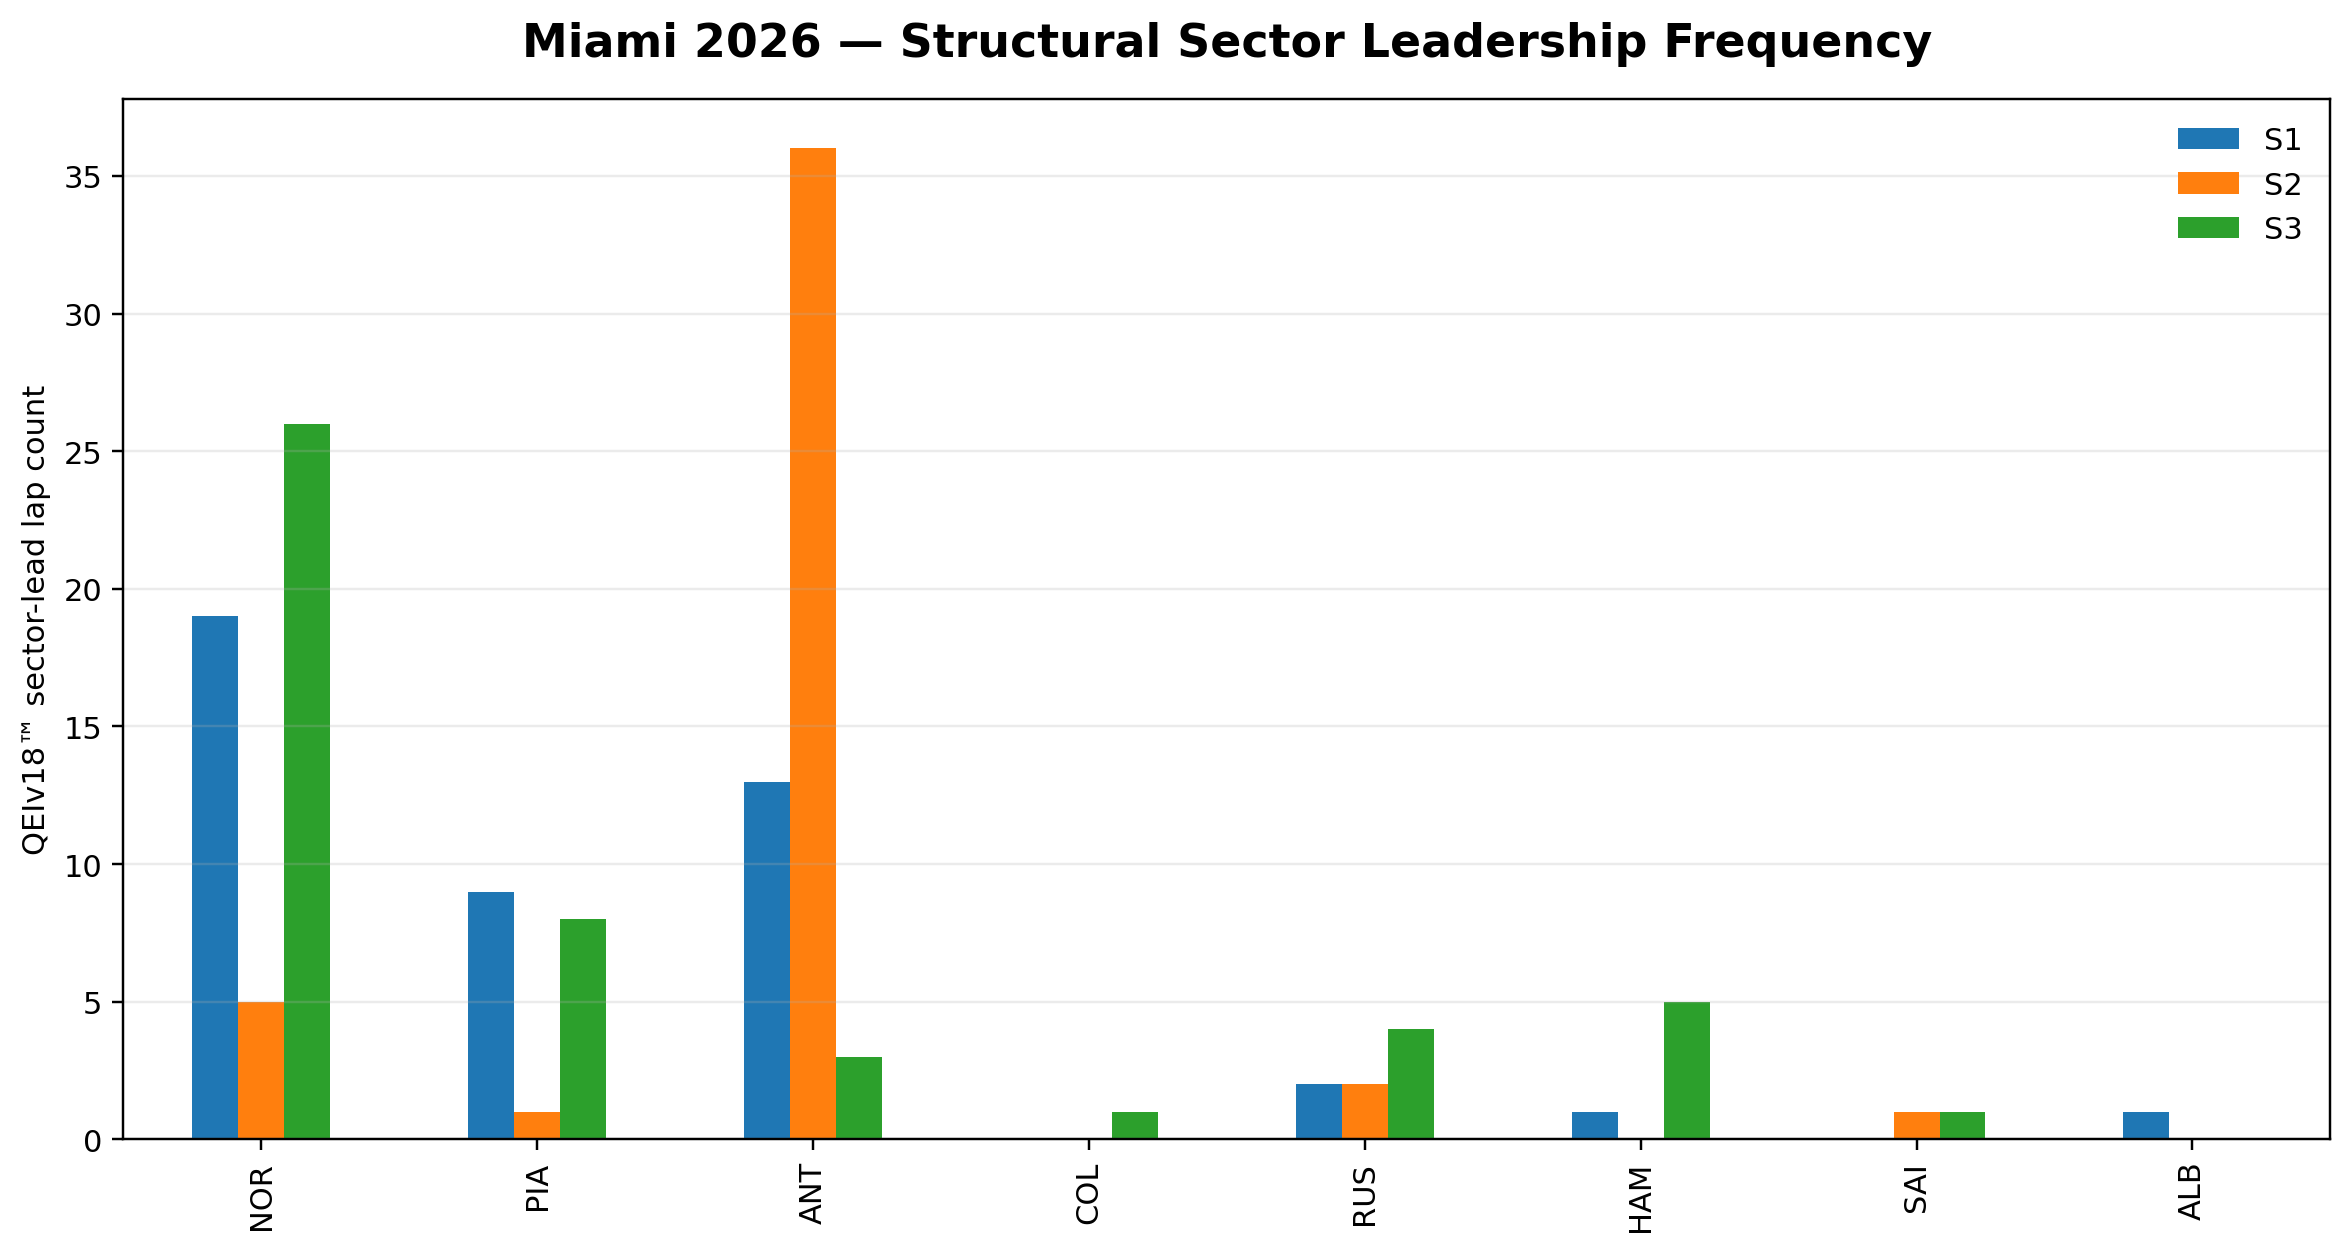
Miami 2026 — sector leaders
Miami adds a different sector structure from Japan. Norris leads S1 and S3, while Antonelli dominates S2. This creates a split race-state picture: McLaren controls the entry and closing phases, while Mercedes holds the strongest middle-sector control signal.
Avg sector rank: 3.84
Best sector laps: 19
Avg sector rank: 2.35
Best sector laps: 36
Avg sector rank: 3.18
Best sector laps: 26
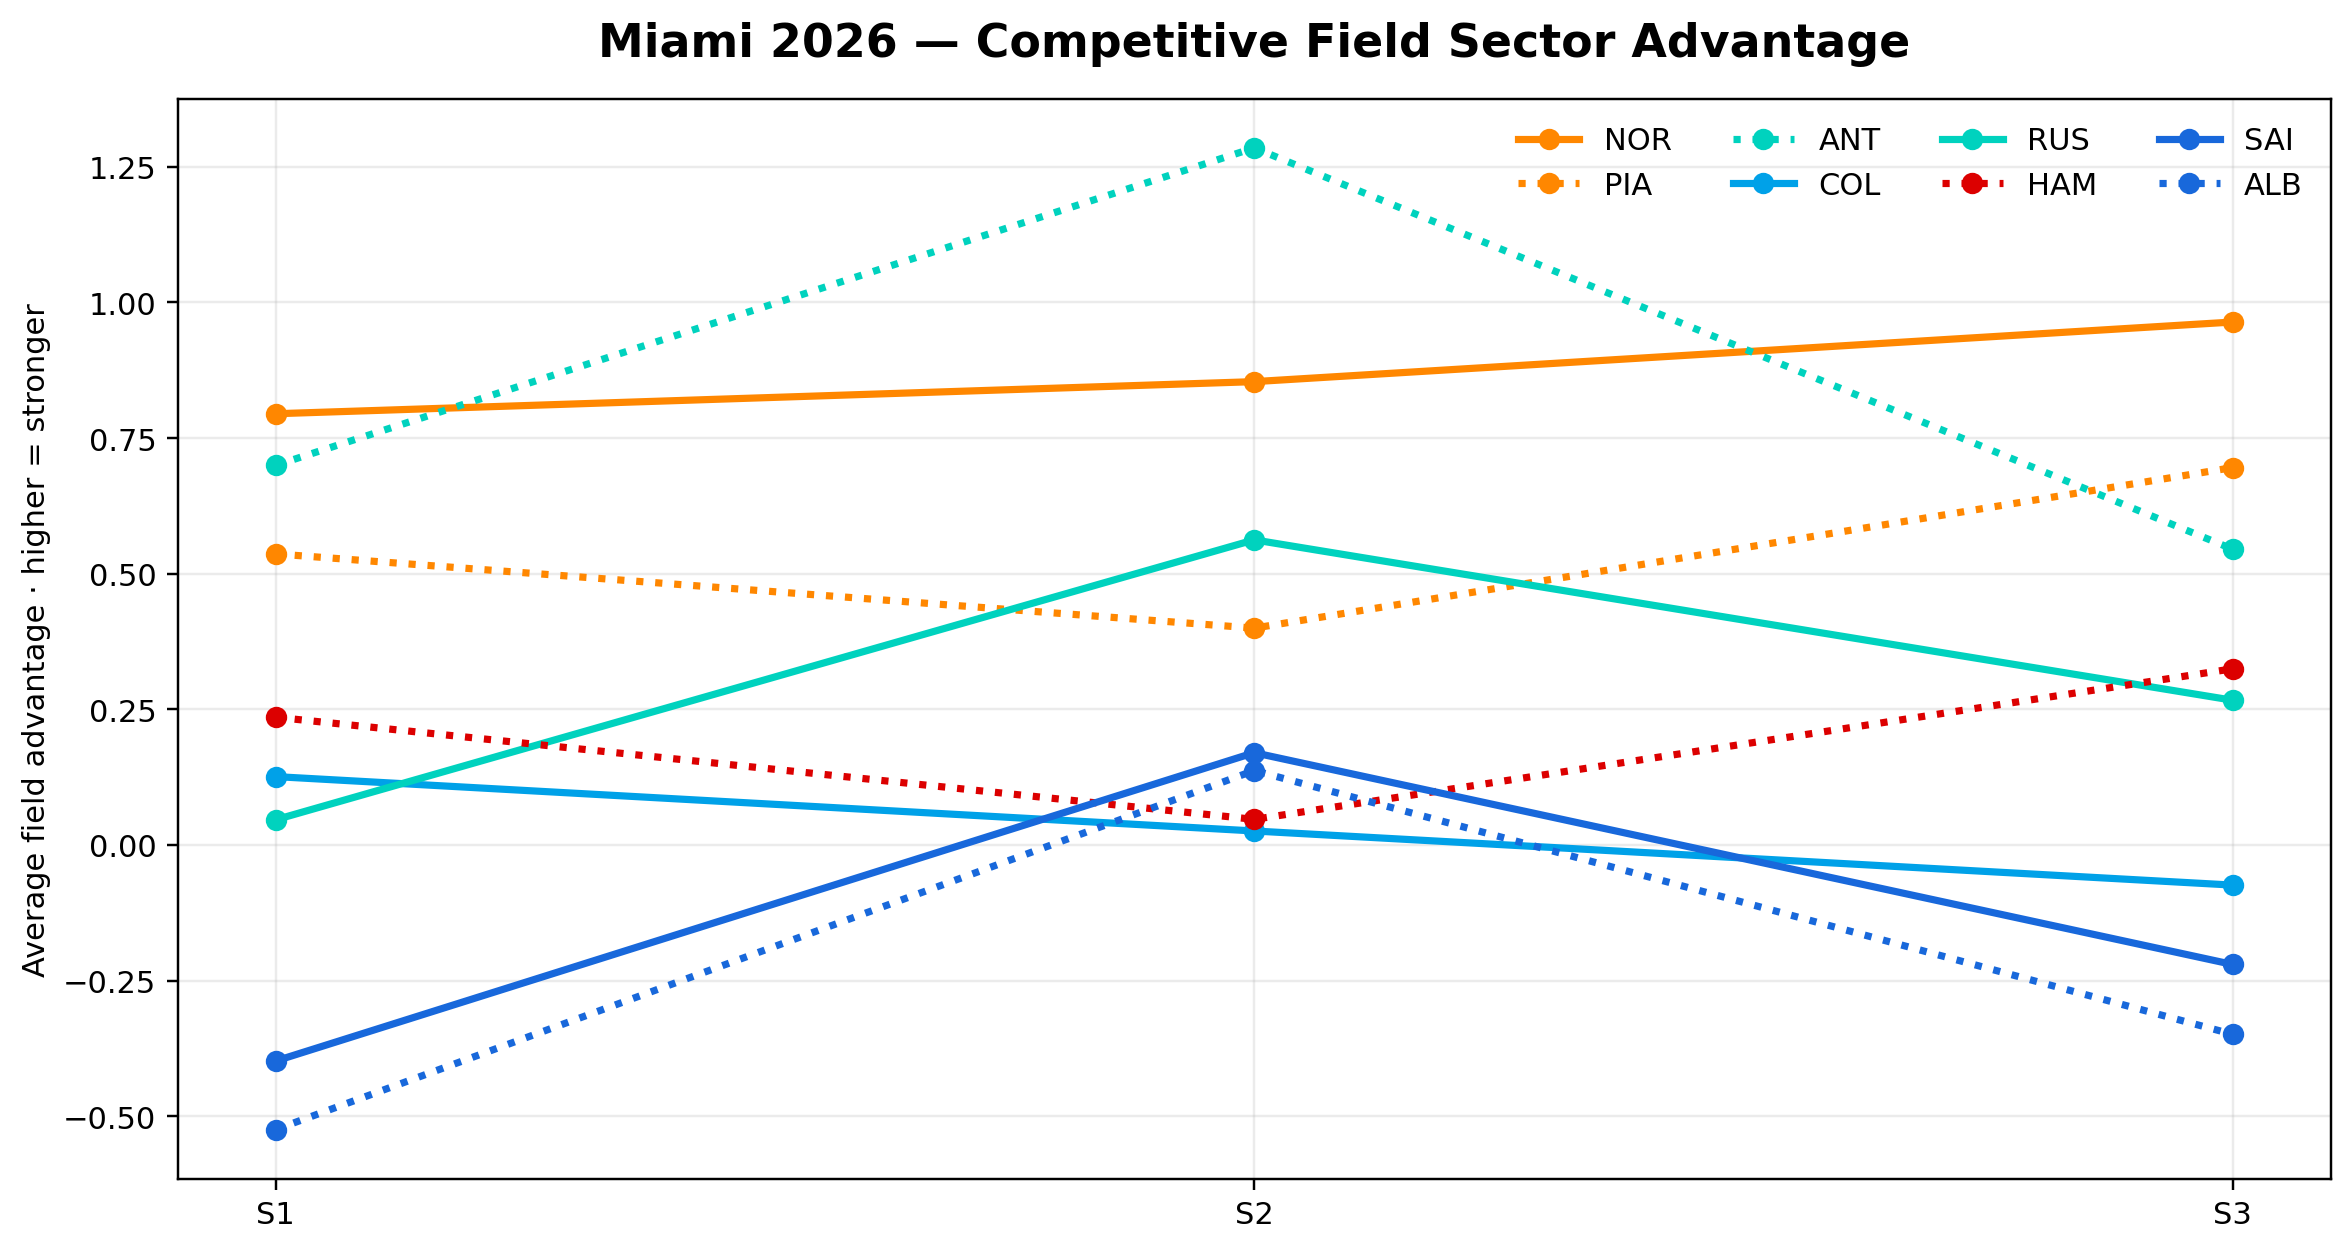
Miami 2026 — front-group sector maps
The Miami sector maps show the race-state split directly. Norris leads the race index and controls S1/S3 structure. Antonelli retains the strongest local control phase in S2. Piastri confirms McLaren depth by ranking strongly in both the race index and the sector maps.
Miami 2026 — upper-group stability layer
The instability layer measures lap-to-lap variability in sector rank inside the evaluated upper group. Lower variability indicates a more repeatable sector-ordering profile, but it is interpreted only alongside field advantage and sector intensity.
Evaluated laps: 56
Evaluated laps: 57
Evaluated laps: 57
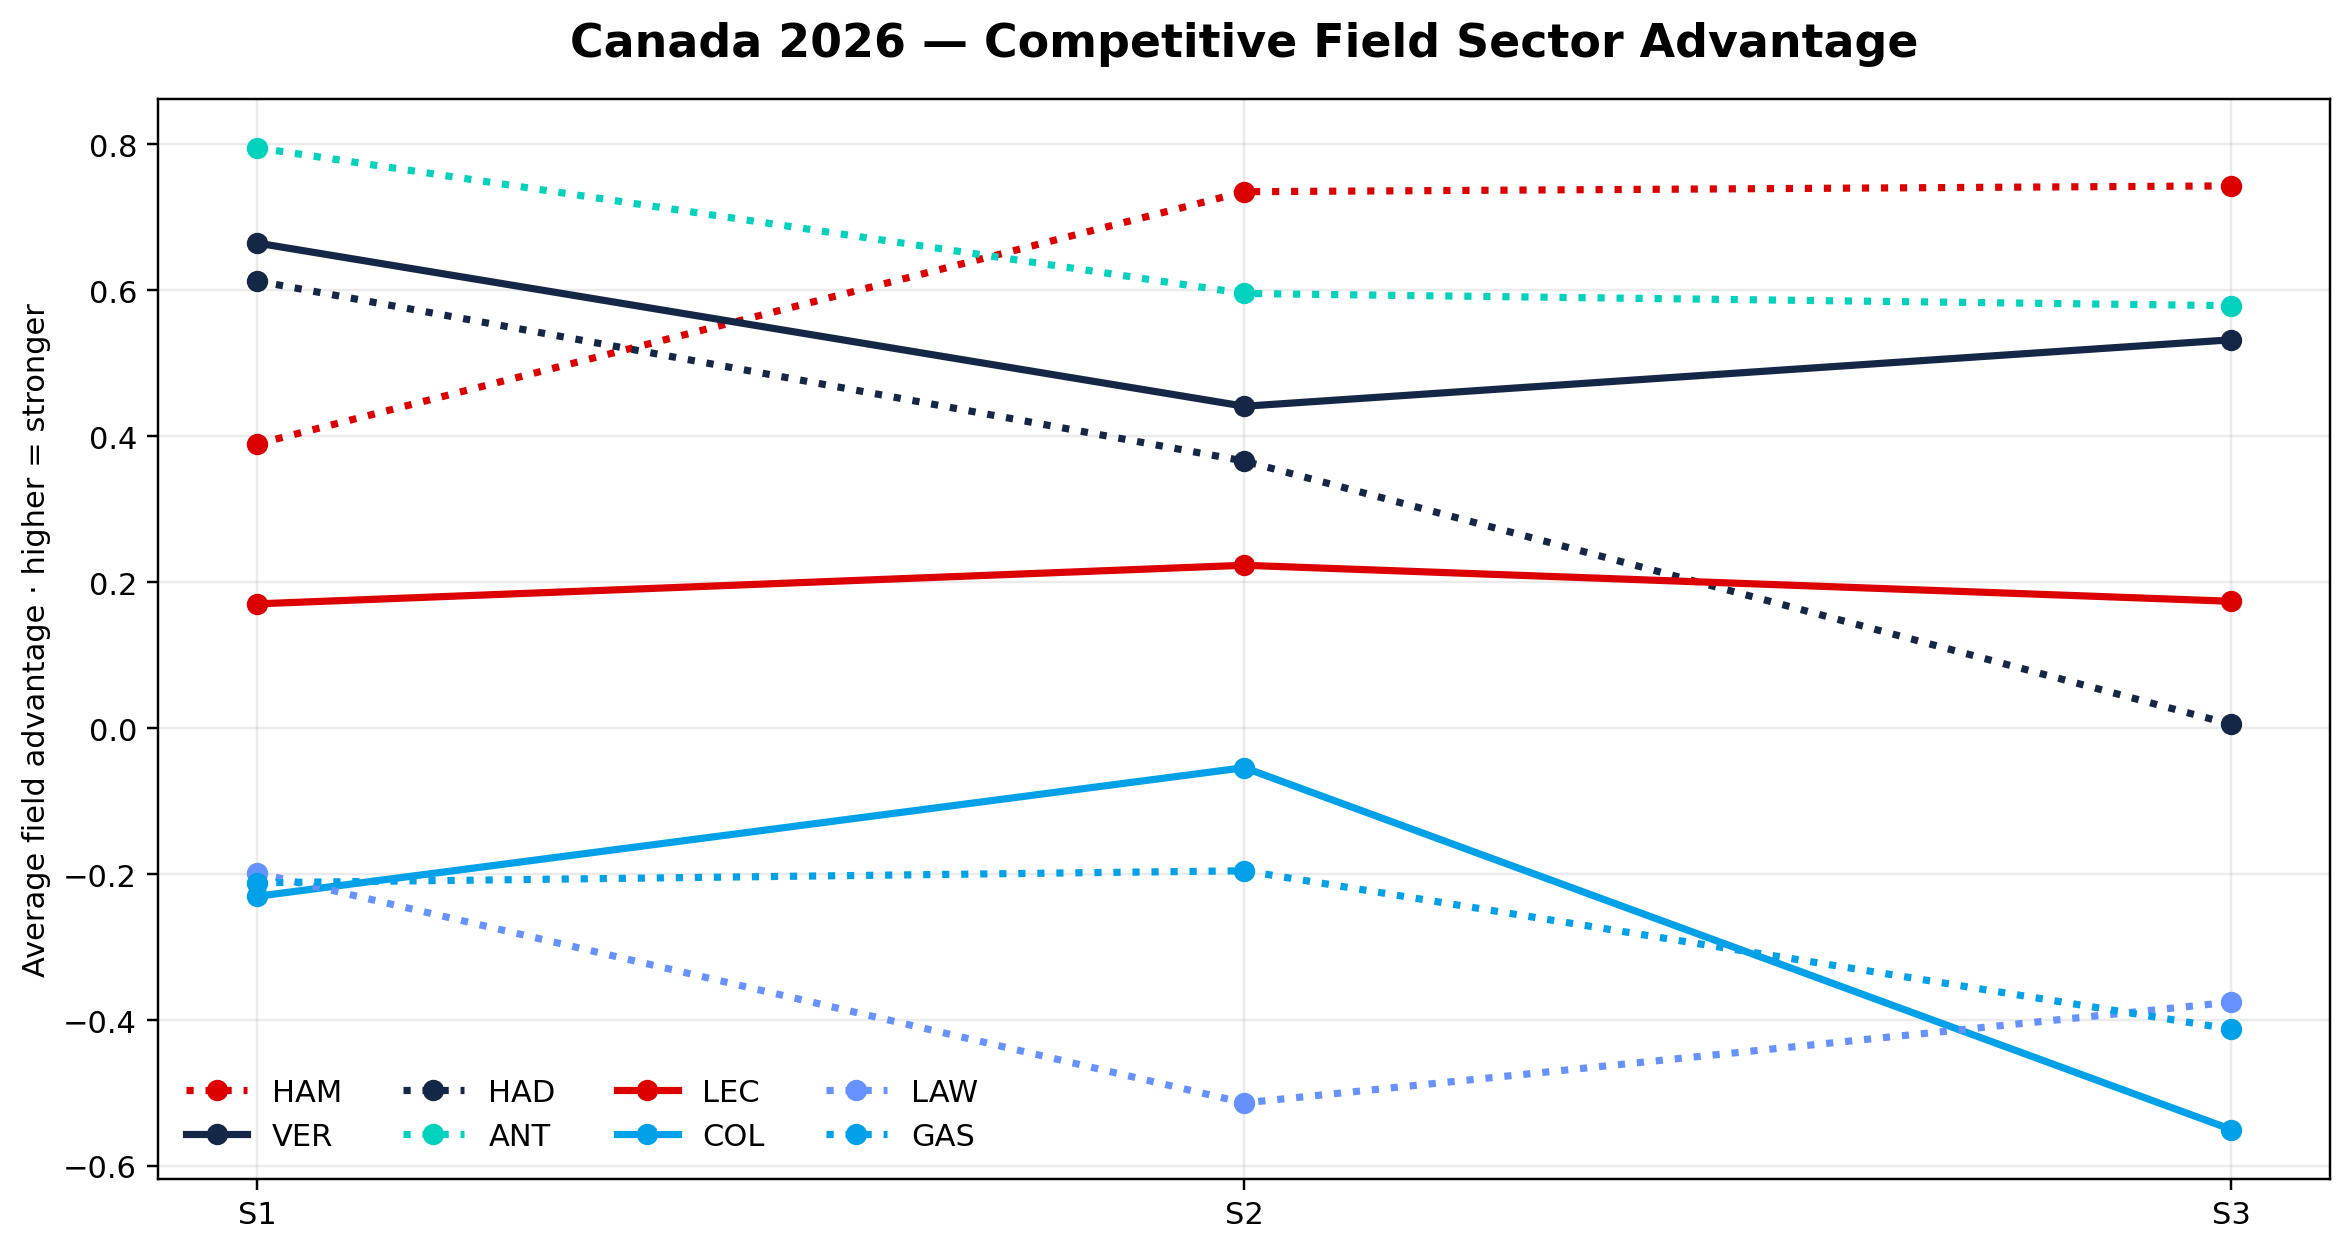
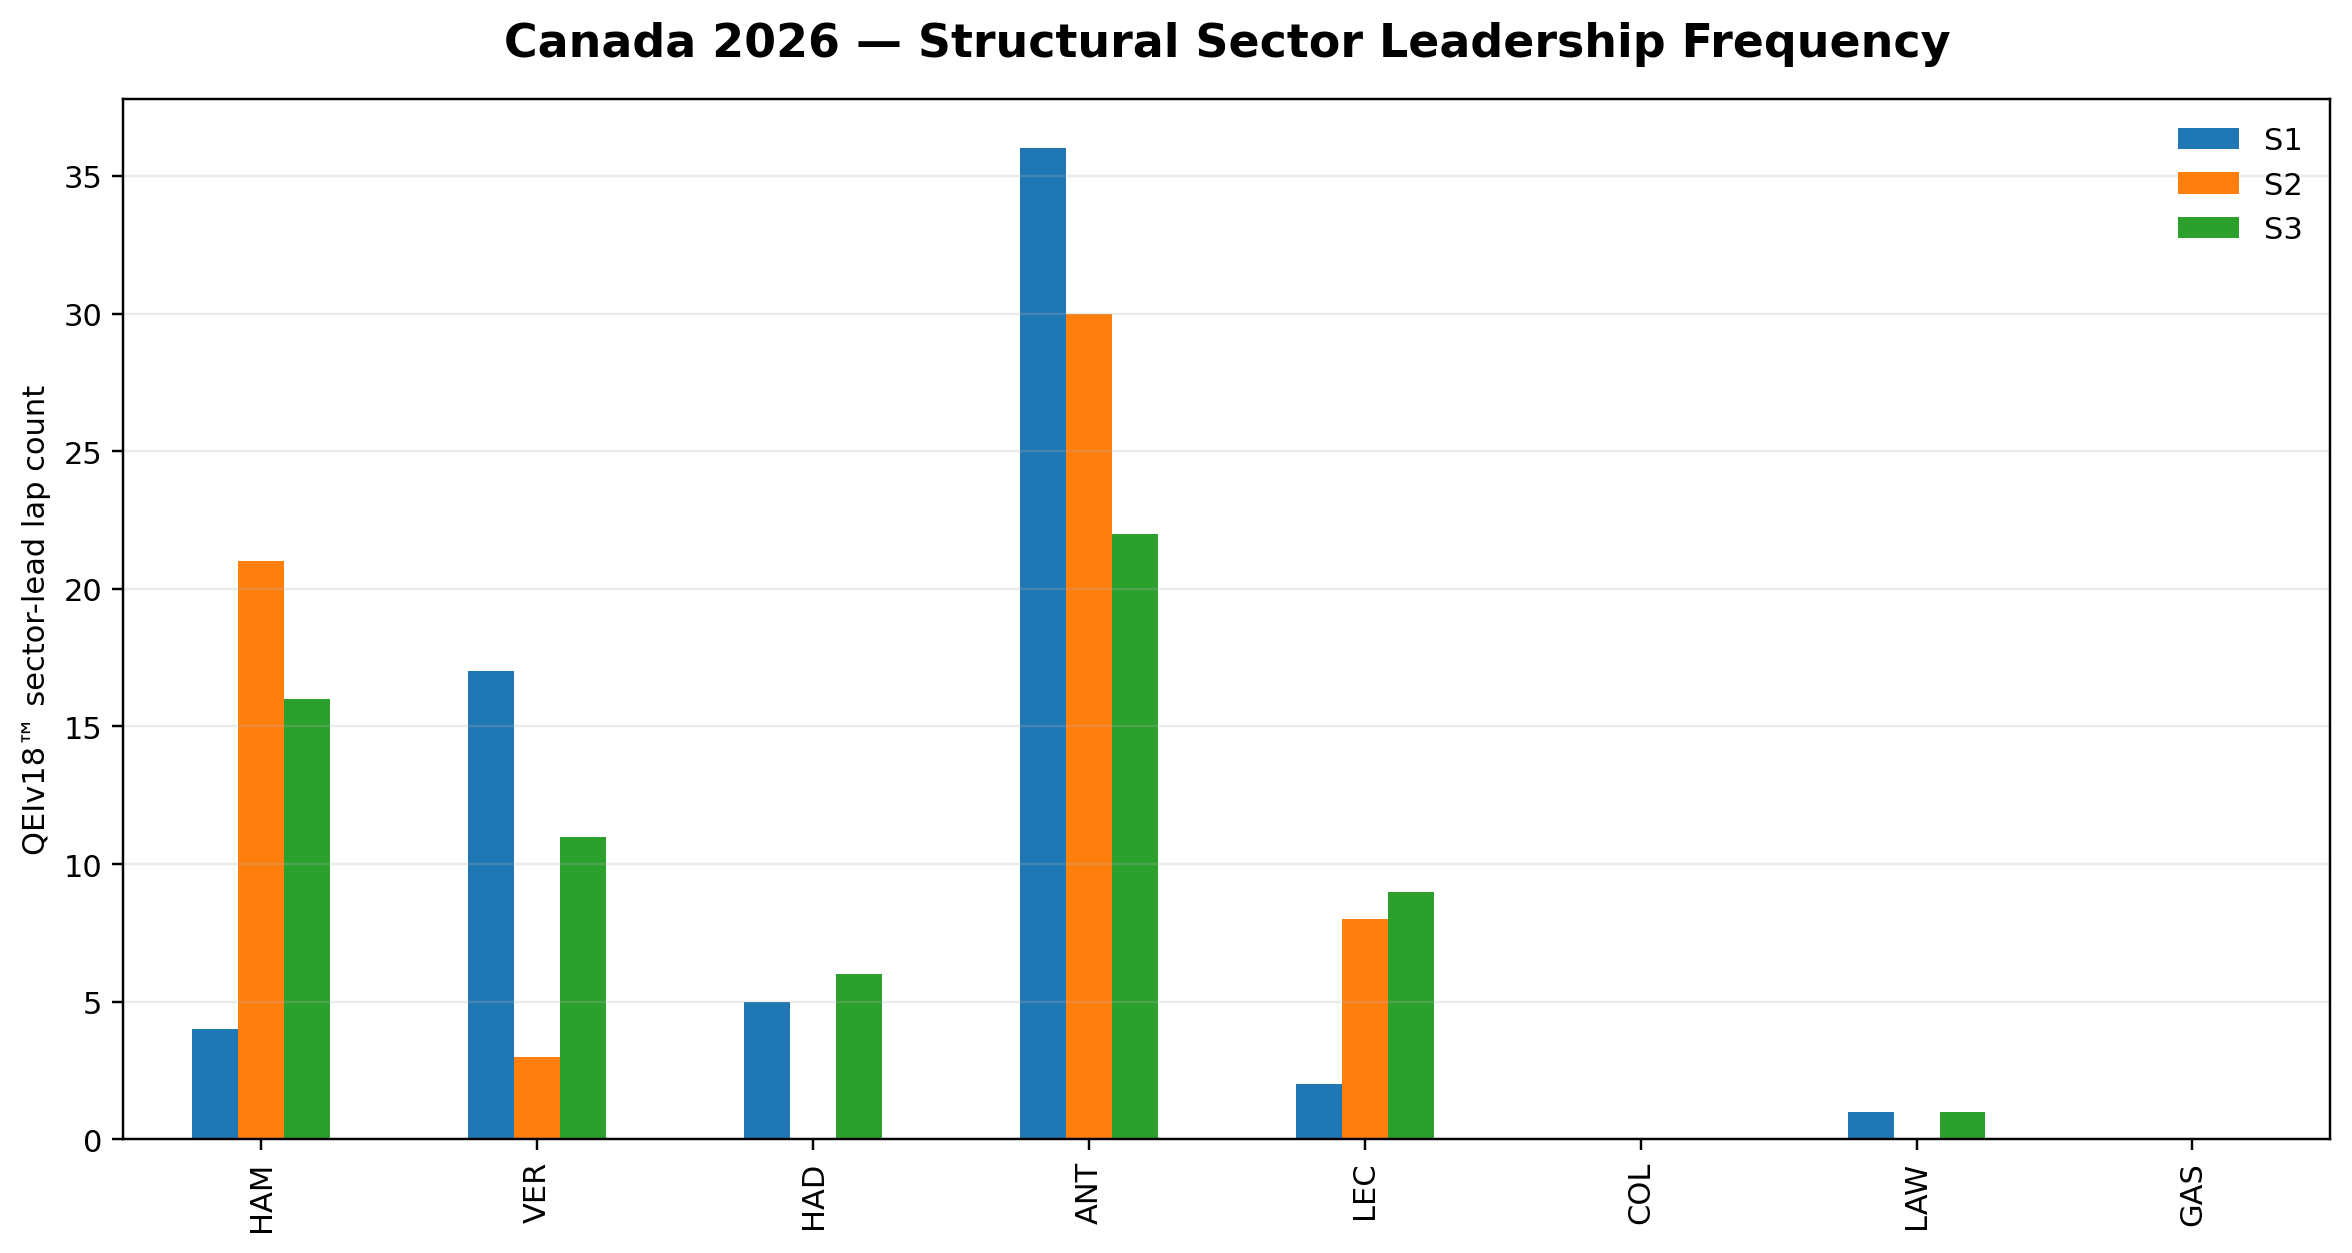
Canada 2026 — sector leaders
Canada shows why sector intelligence is essential. Hamilton and Verstappen convert the strongest event-score layer, while Antonelli remains one of the strongest raw sector-control references. The sector maps separate event conversion, local control, and repeatability.
Avg sector rank: 3.32
Best sector laps: 17
Avg sector rank: 2.89
Best sector laps: 21
Avg sector rank: 3.03
Best sector laps: 16
Canada 2026 — competitive sector maps
The Canada sector maps follow the Miami presentation principle: first show sector advantage intensity, then sector ordering, then structural sector leadership frequency.
Canada 2026 — upper-group sector stability layer
The stability layer measures lap-to-lap sector-rank variability inside the Canada upper group. Lower variability means the sector profile is more repeatable; it should be interpreted alongside advantage intensity.
Evaluated laps: 66
Evaluated laps: 66
Evaluated laps: 66