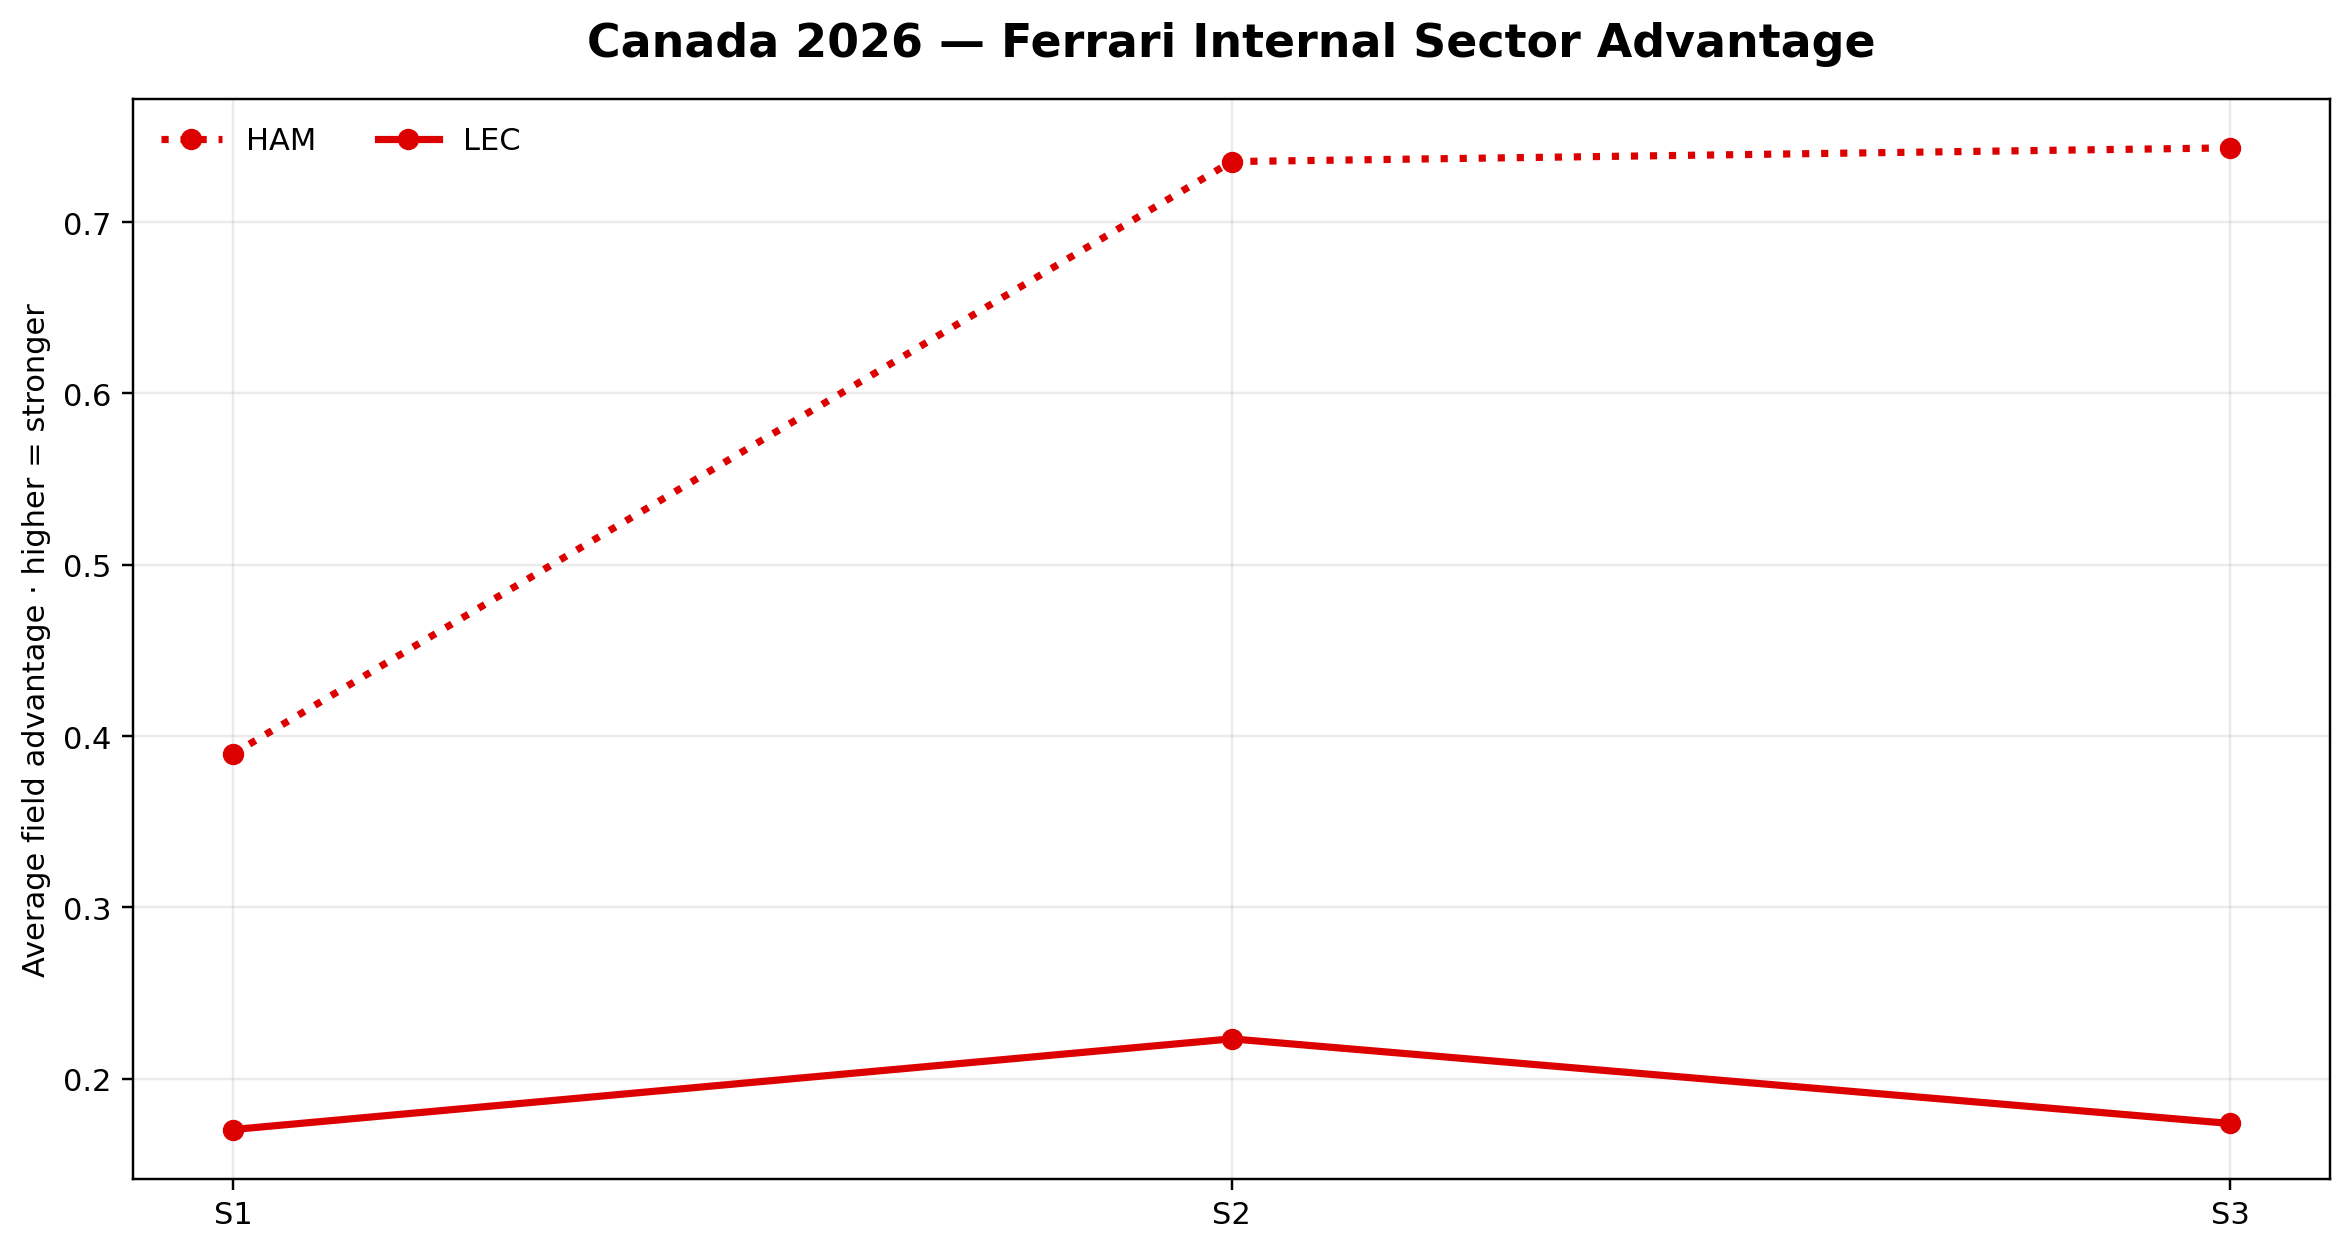
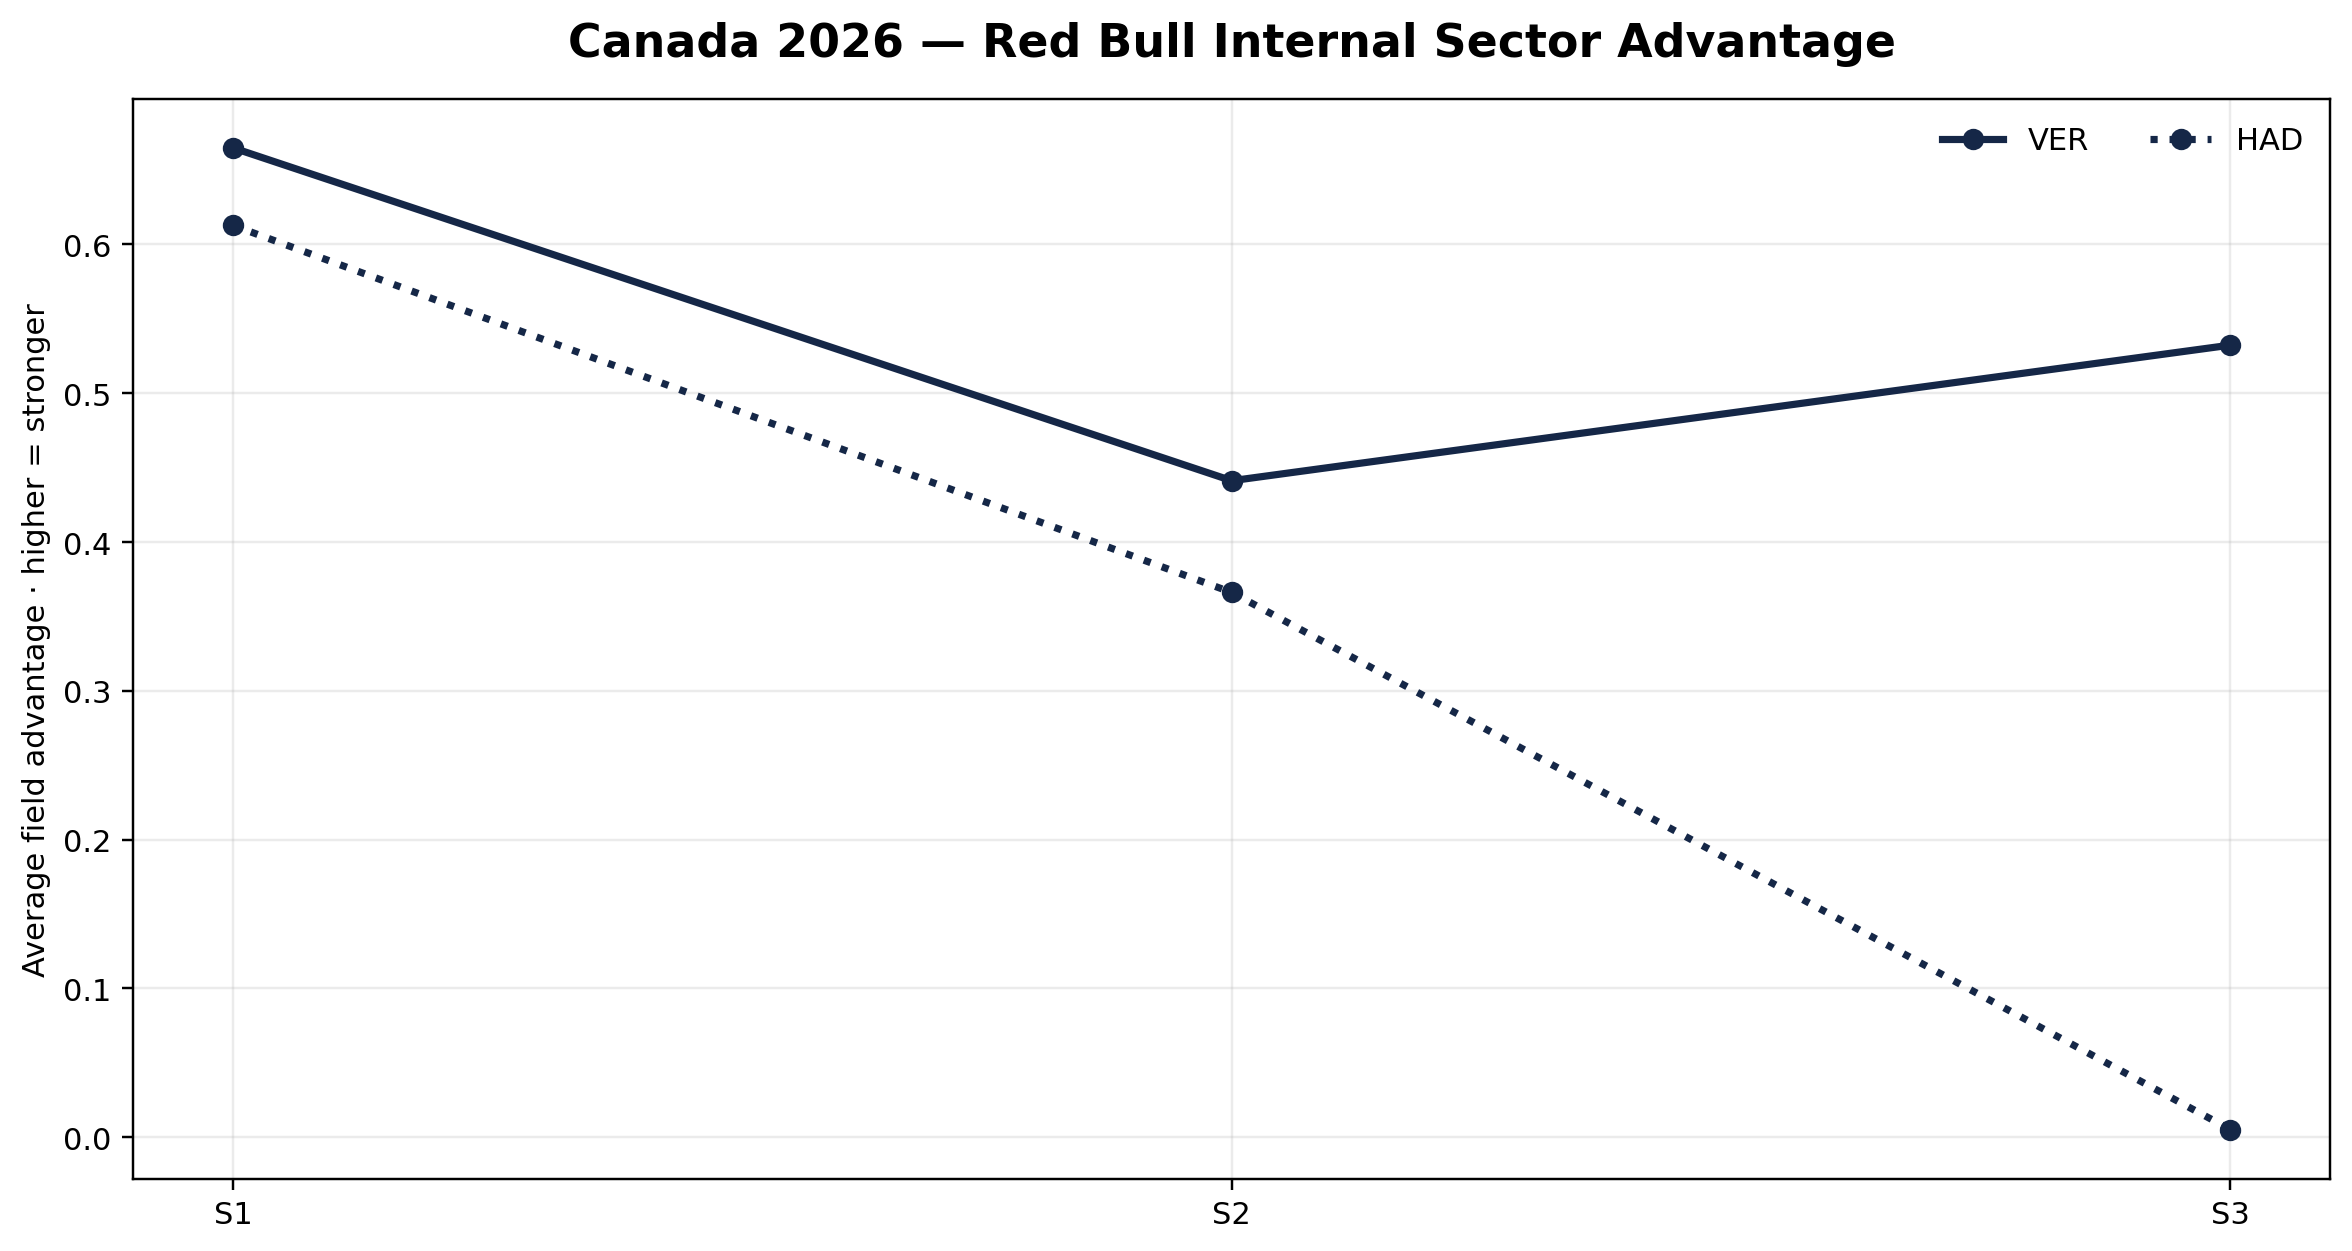
Canada 2026
Canada is a useful stress test for QEIv18™: Hamilton and Verstappen are almost tied at the event-score level, Red Bull shows two-driver depth through Hadjar, and Antonelli remains stronger than his event rank suggests when the sector-control layer is inspected directly.
Executive summary
Canada separates event-score conversion from raw structural control.
QEIv18™ race-state hierarchy
This is the Canada event score. It is not the cumulative QEIv18™ Championship table.
| Rank | Driver | Team | QEIv18™ score | Field control | Avg ordering | Best ordering |
|---|---|---|---|---|---|---|
| 1 | HAM | Ferrari | 88.70 | 0.623 | 3.36 | 1 |
| 2 | VER | Red Bull Racing | 88.67 | 0.546 | 3.55 | 1 |
| 3 | HAD | Red Bull Racing | 81.37 | 0.328 | 4.84 | 1 |
| 4 | ANT | Mercedes | 75.00 | 0.657 | 2.92 | 1 |
| 5 | LEC | Ferrari | 74.27 | 0.189 | 4.76 | 1 |
| 6 | COL | Alpine | 71.73 | -0.278 | 8.45 | 5 |
| 7 | LAW | Racing Bulls | 67.48 | -0.362 | 9.53 | 2 |
| 8 | GAS | Alpine | 61.75 | -0.273 | 8.73 | 1 |
| 9 | BEA | Haas F1 Team | 60.33 | -0.448 | 10.00 | 3 |
| 10 | SAI | Williams | 60.08 | -0.392 | 8.35 | 1 |
Important diagnostic note: Antonelli has the strongest field-control value in this table (0.657) and the best average ordering (2.92), but ranks fourth in the event score because the score also includes stability and peak/repeatability components. This is exactly why Canada needs careful interpretation.
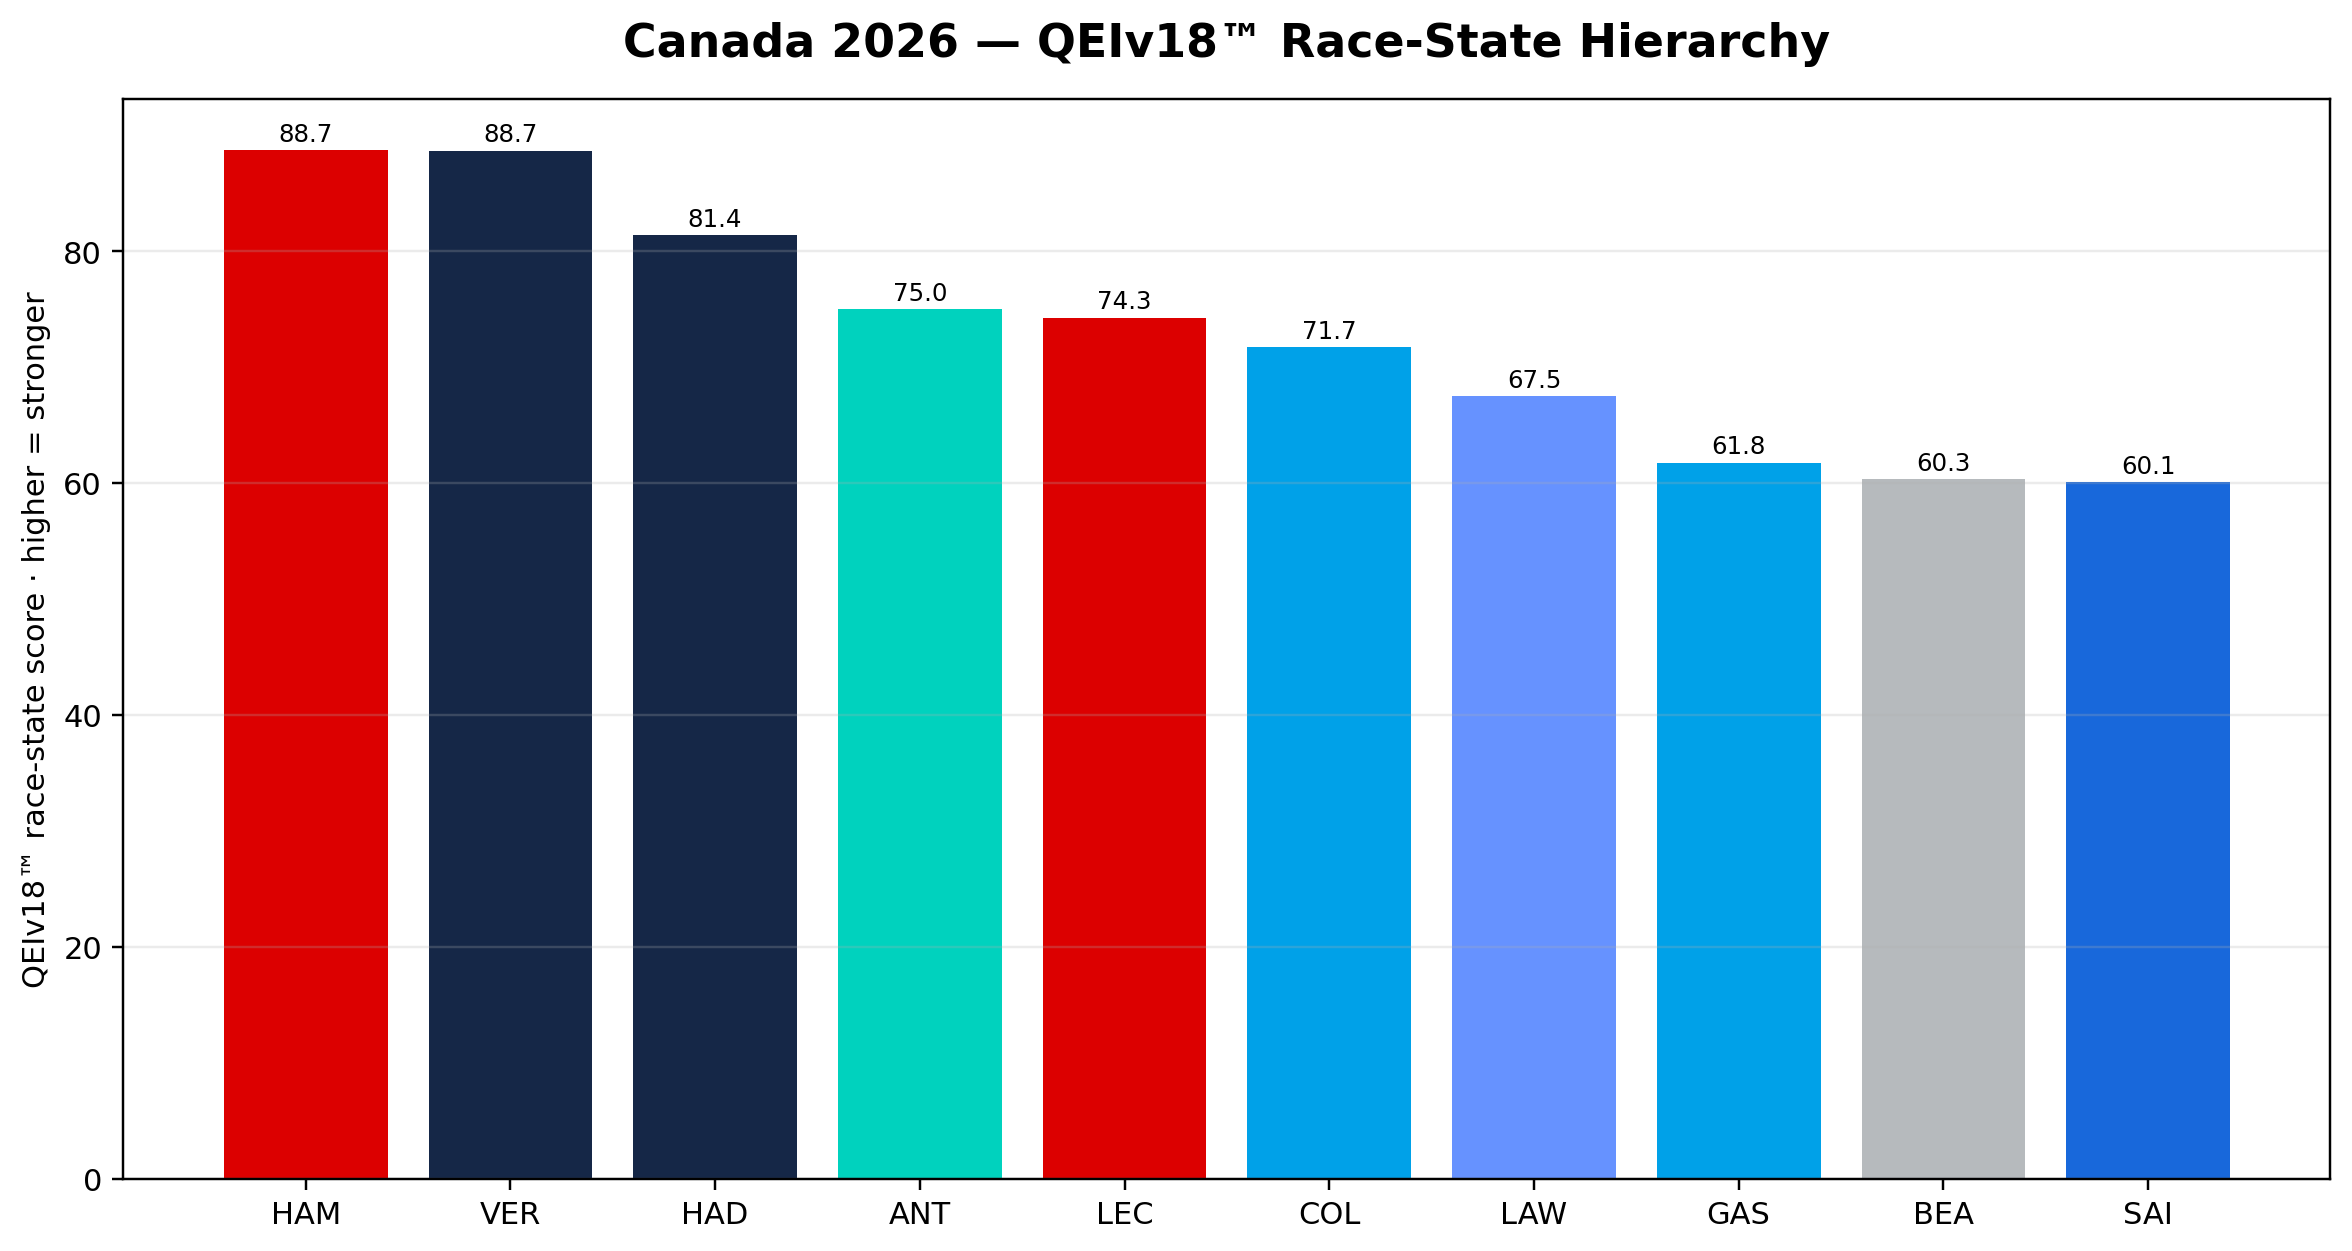
QEIv18™ separates different ways of being strong. One driver may impose stronger raw control; another may convert slightly weaker control more cleanly over the race distance.
| Layer | Competitive interpretation | Canada signal | Supporting number |
|---|---|---|---|
| Structural Control | Ability to impose race-state order on the field. | ANT strongest raw control layer. | Field control 0.657 · avg ordering 2.92 |
| Conversion Efficiency | Ability to convert structure into a clean event score. | HAM and VER convert most cleanly. | HAM 88.70 · VER 88.67 |
| Volatility / Instability | High control with more oscillation or less repeatability. | ANT carries the key diagnostic tension. | Best control, but event score only 75.00 |
| Peak Aggression | Maximum pressure capability during attack/control windows. | ANT and VER show strongest pressure signatures. | ANT S1/S2 lead frequency · VER S1 leader |
| Structural Endurance | Capacity to preserve usable structure across race distance. | HAM converts strongest full-event outcome. | Event score P1 · S2/S3 leader |
| Championship Sustainability | Long-term profile: control plus repeatability over many races. | ANT remains cumulative QEIv18™ reference. | Season rank P1 after Canada |
Race intelligence read: powerful driving can win short-term if the control peaks are strong enough, but repeatable structure is usually the safer championship profile. Canada shows both forces at once.
Sector intelligence
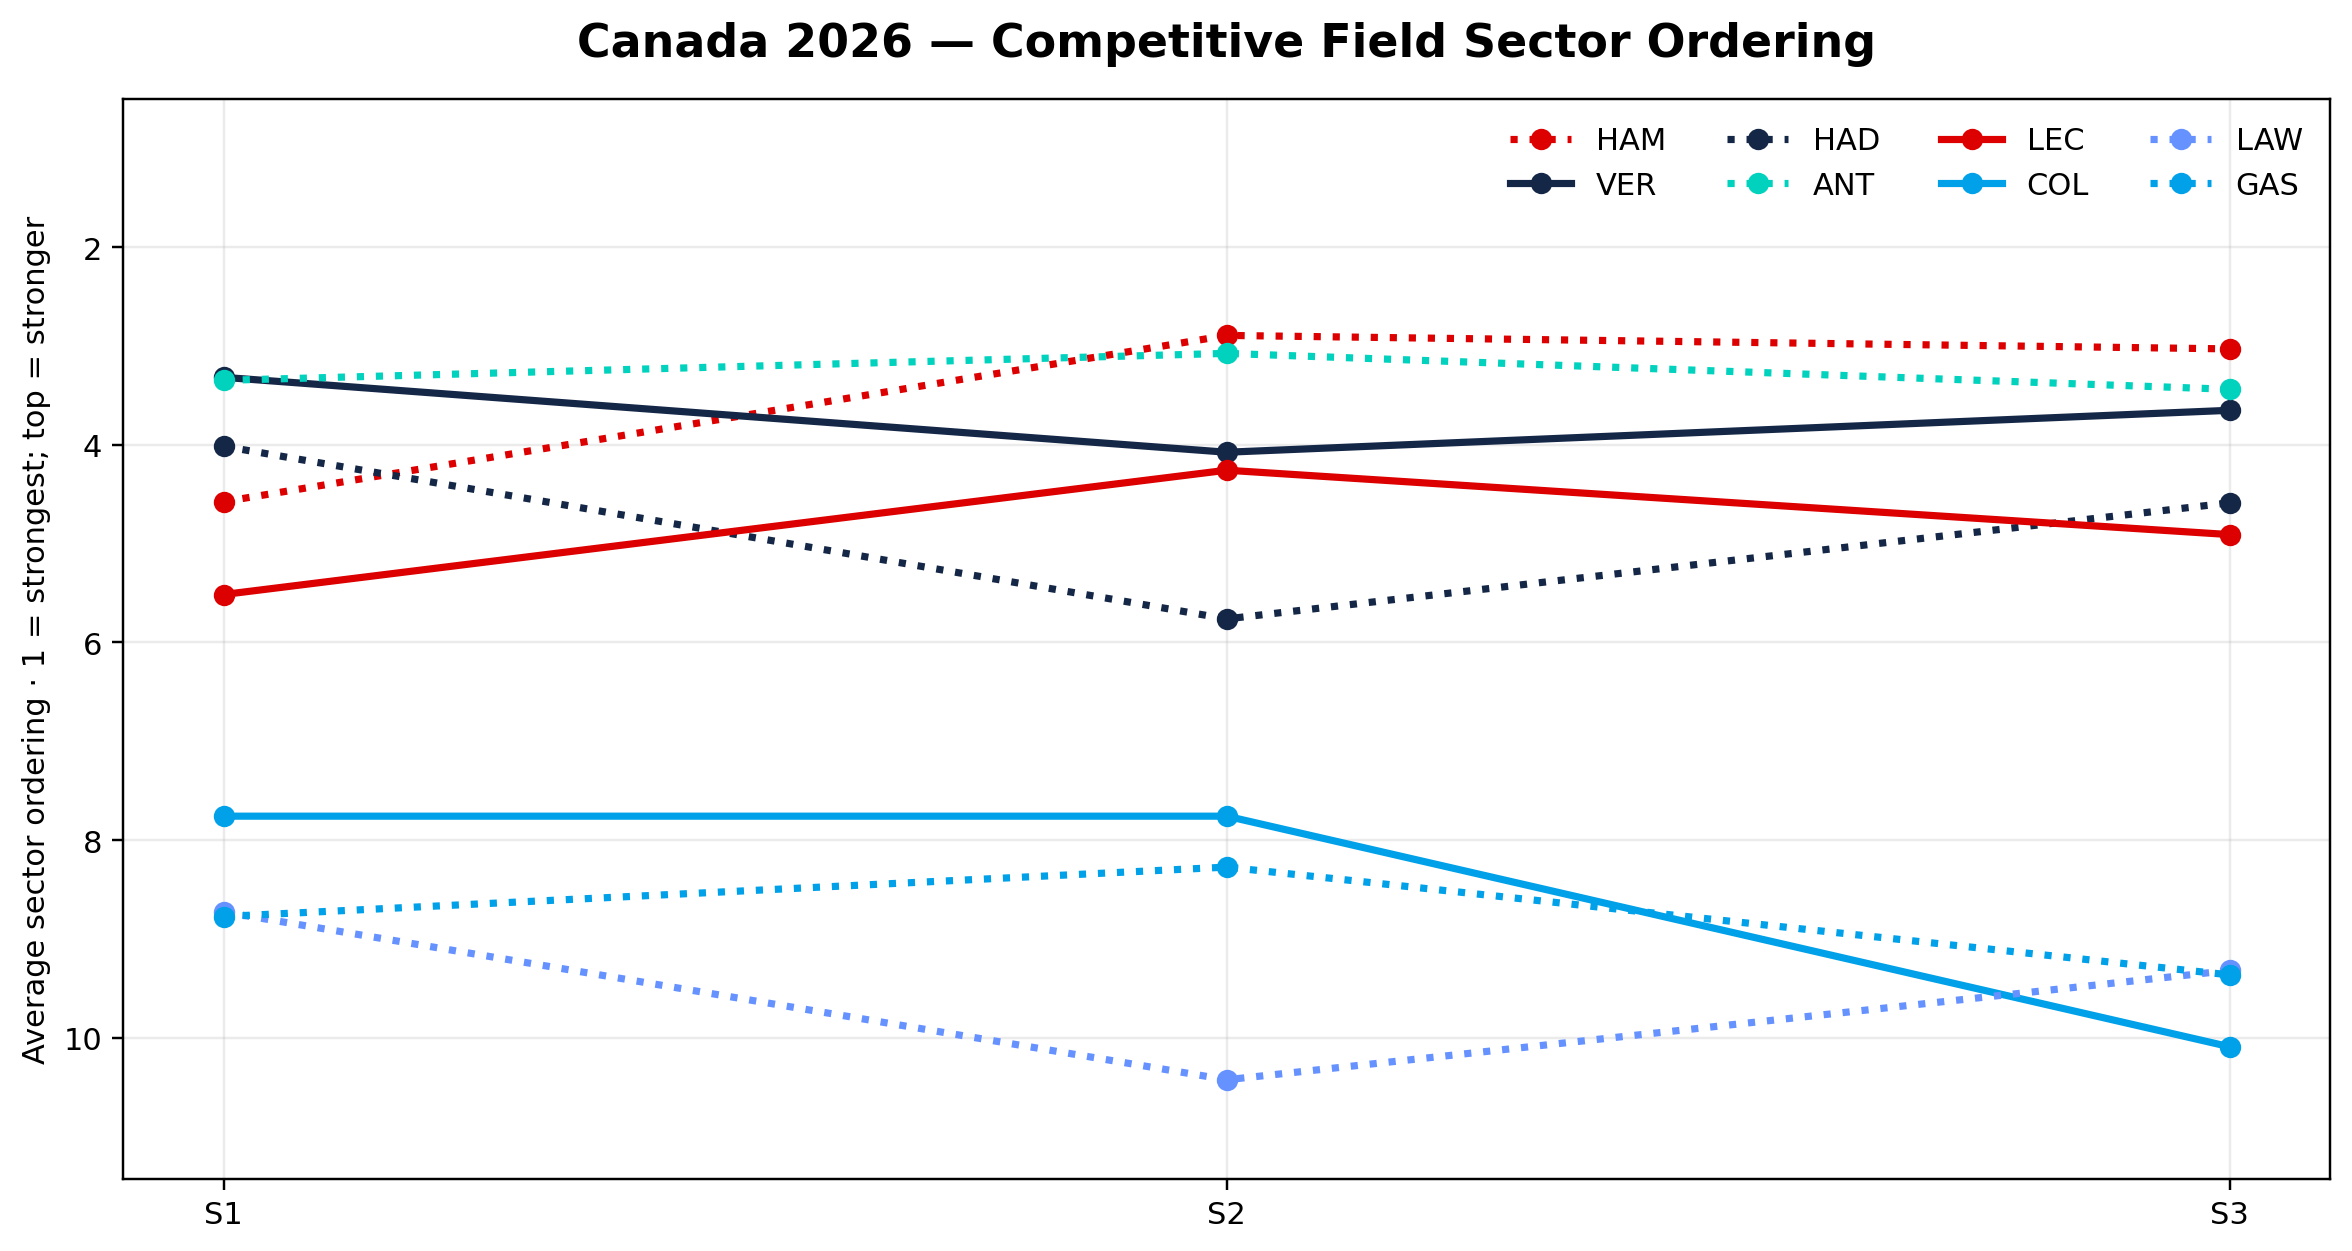
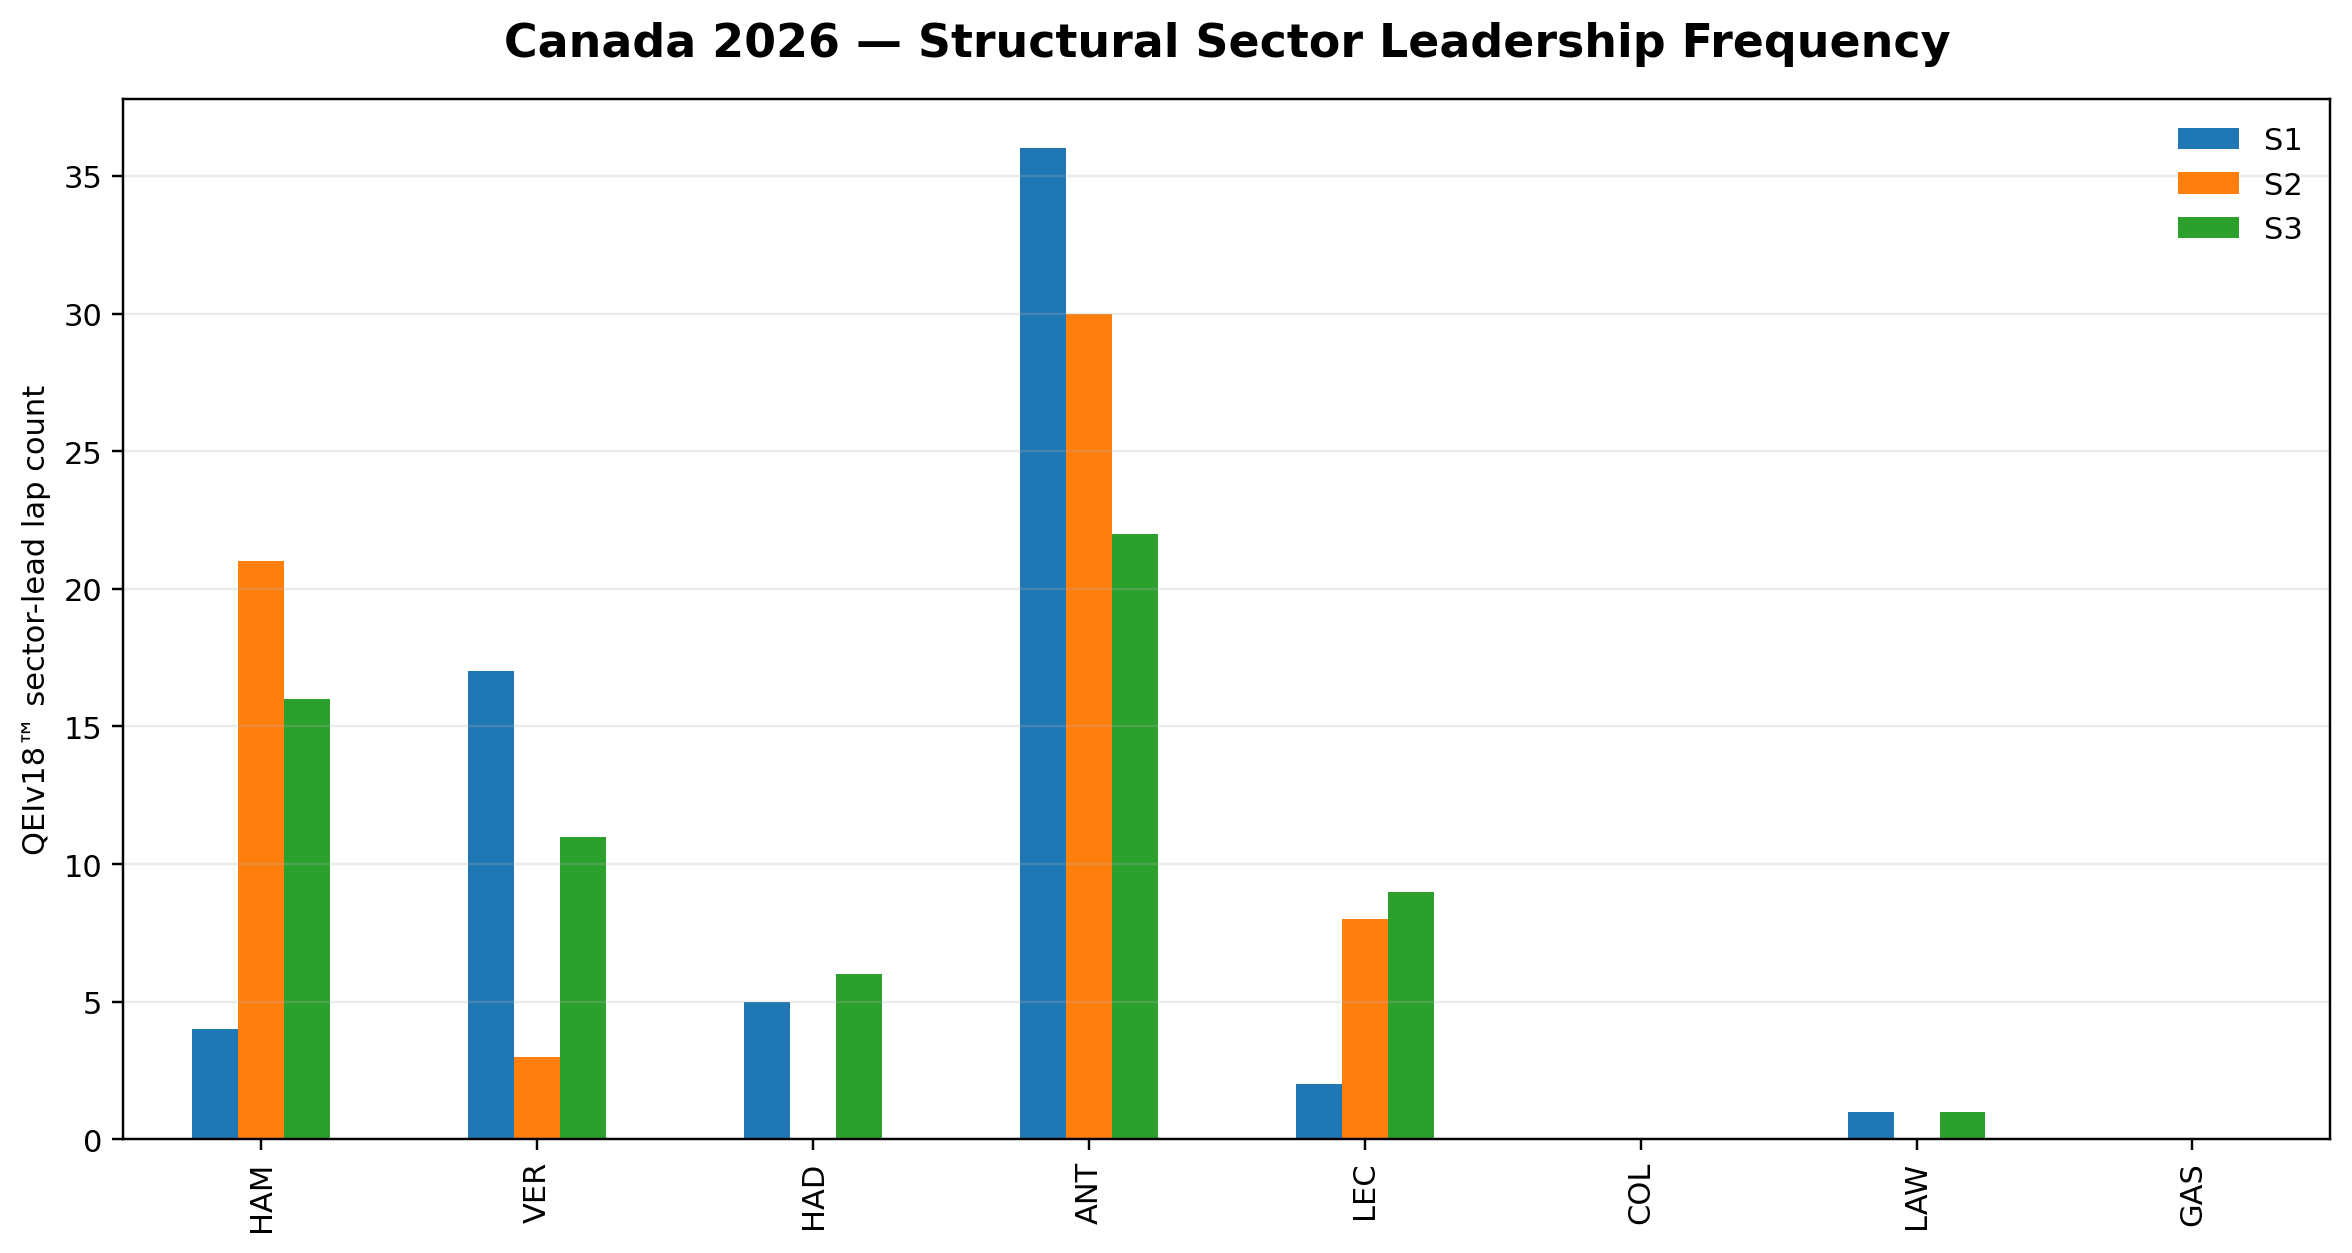
The sector layer explains why Antonelli looks stronger than his event rank in several views.
Avg sector ordering: 3.32
Sector lead laps: 17
Avg sector ordering: 2.89
Sector lead laps: 21
Avg sector ordering: 3.03
Sector lead laps: 16
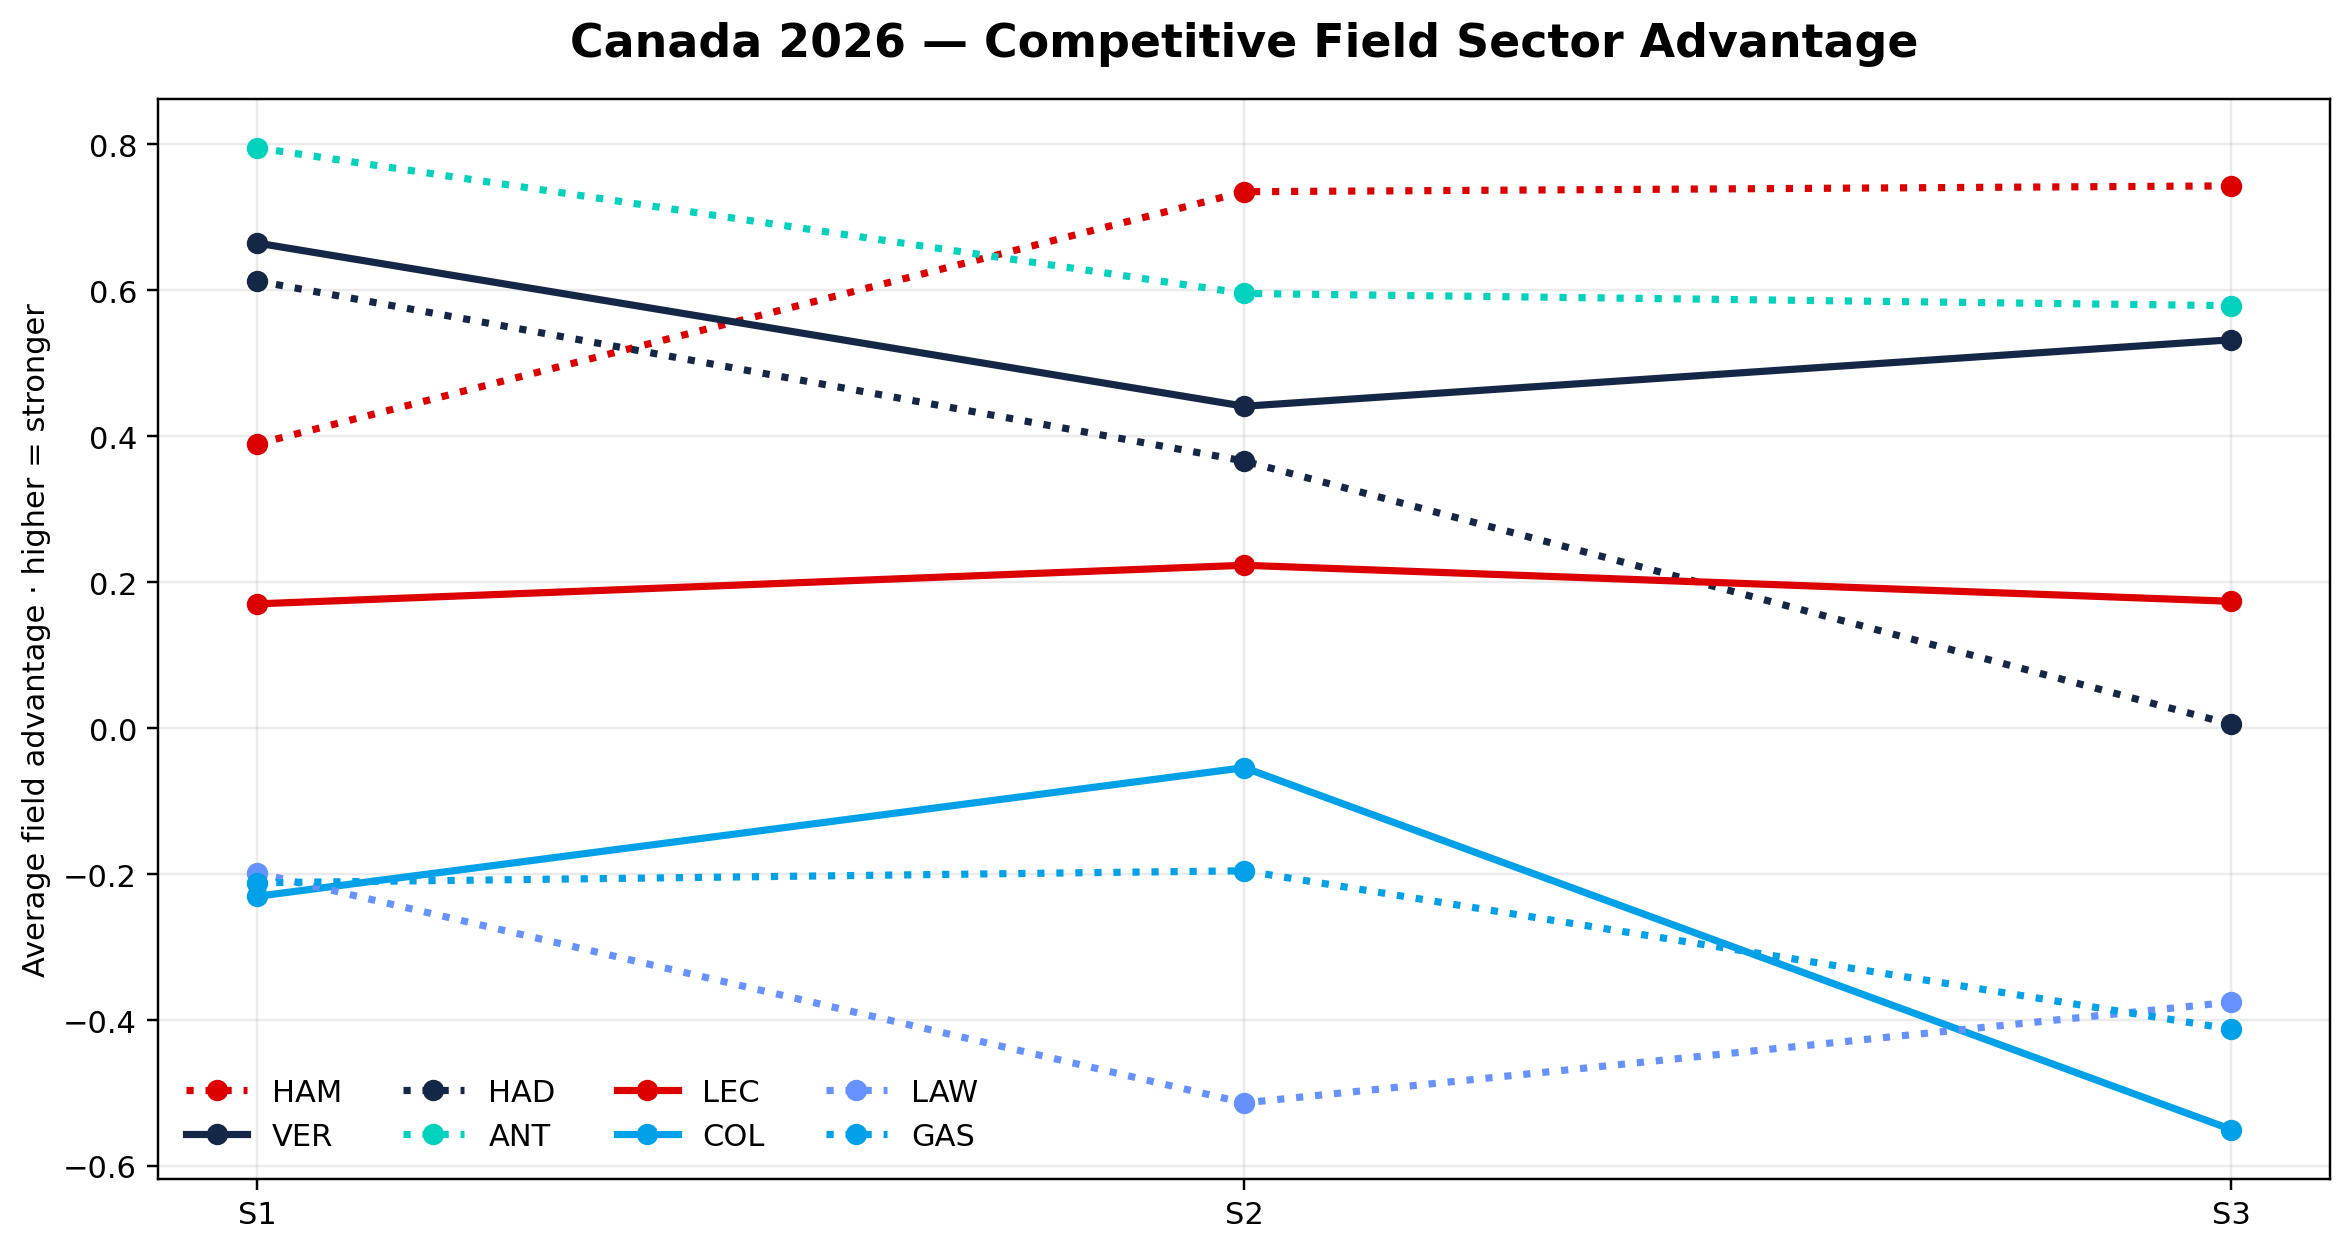
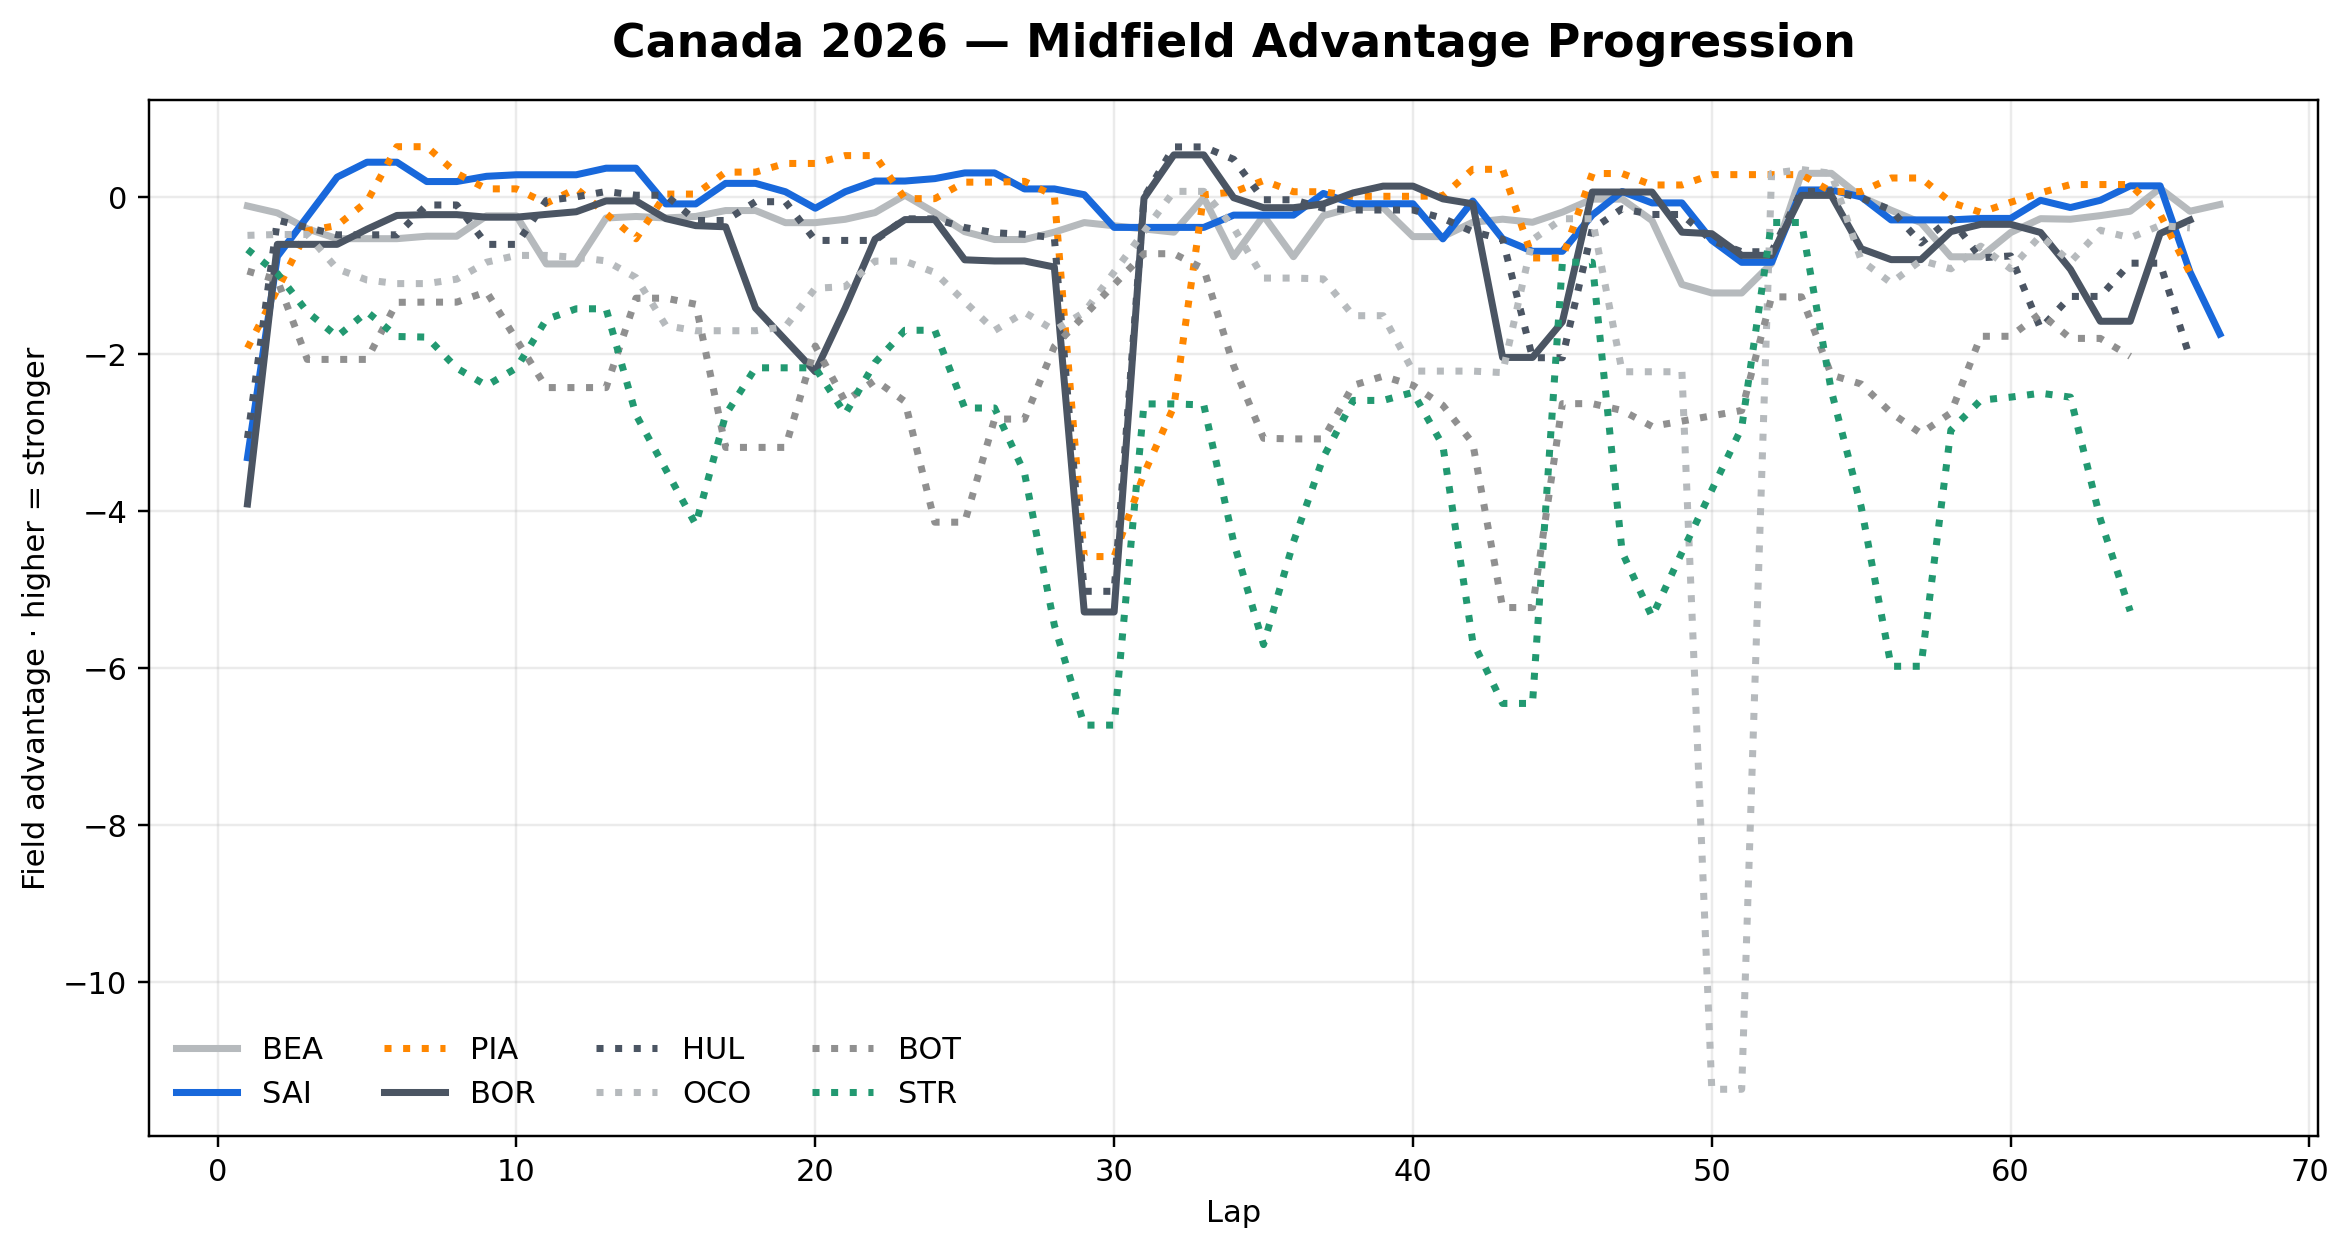
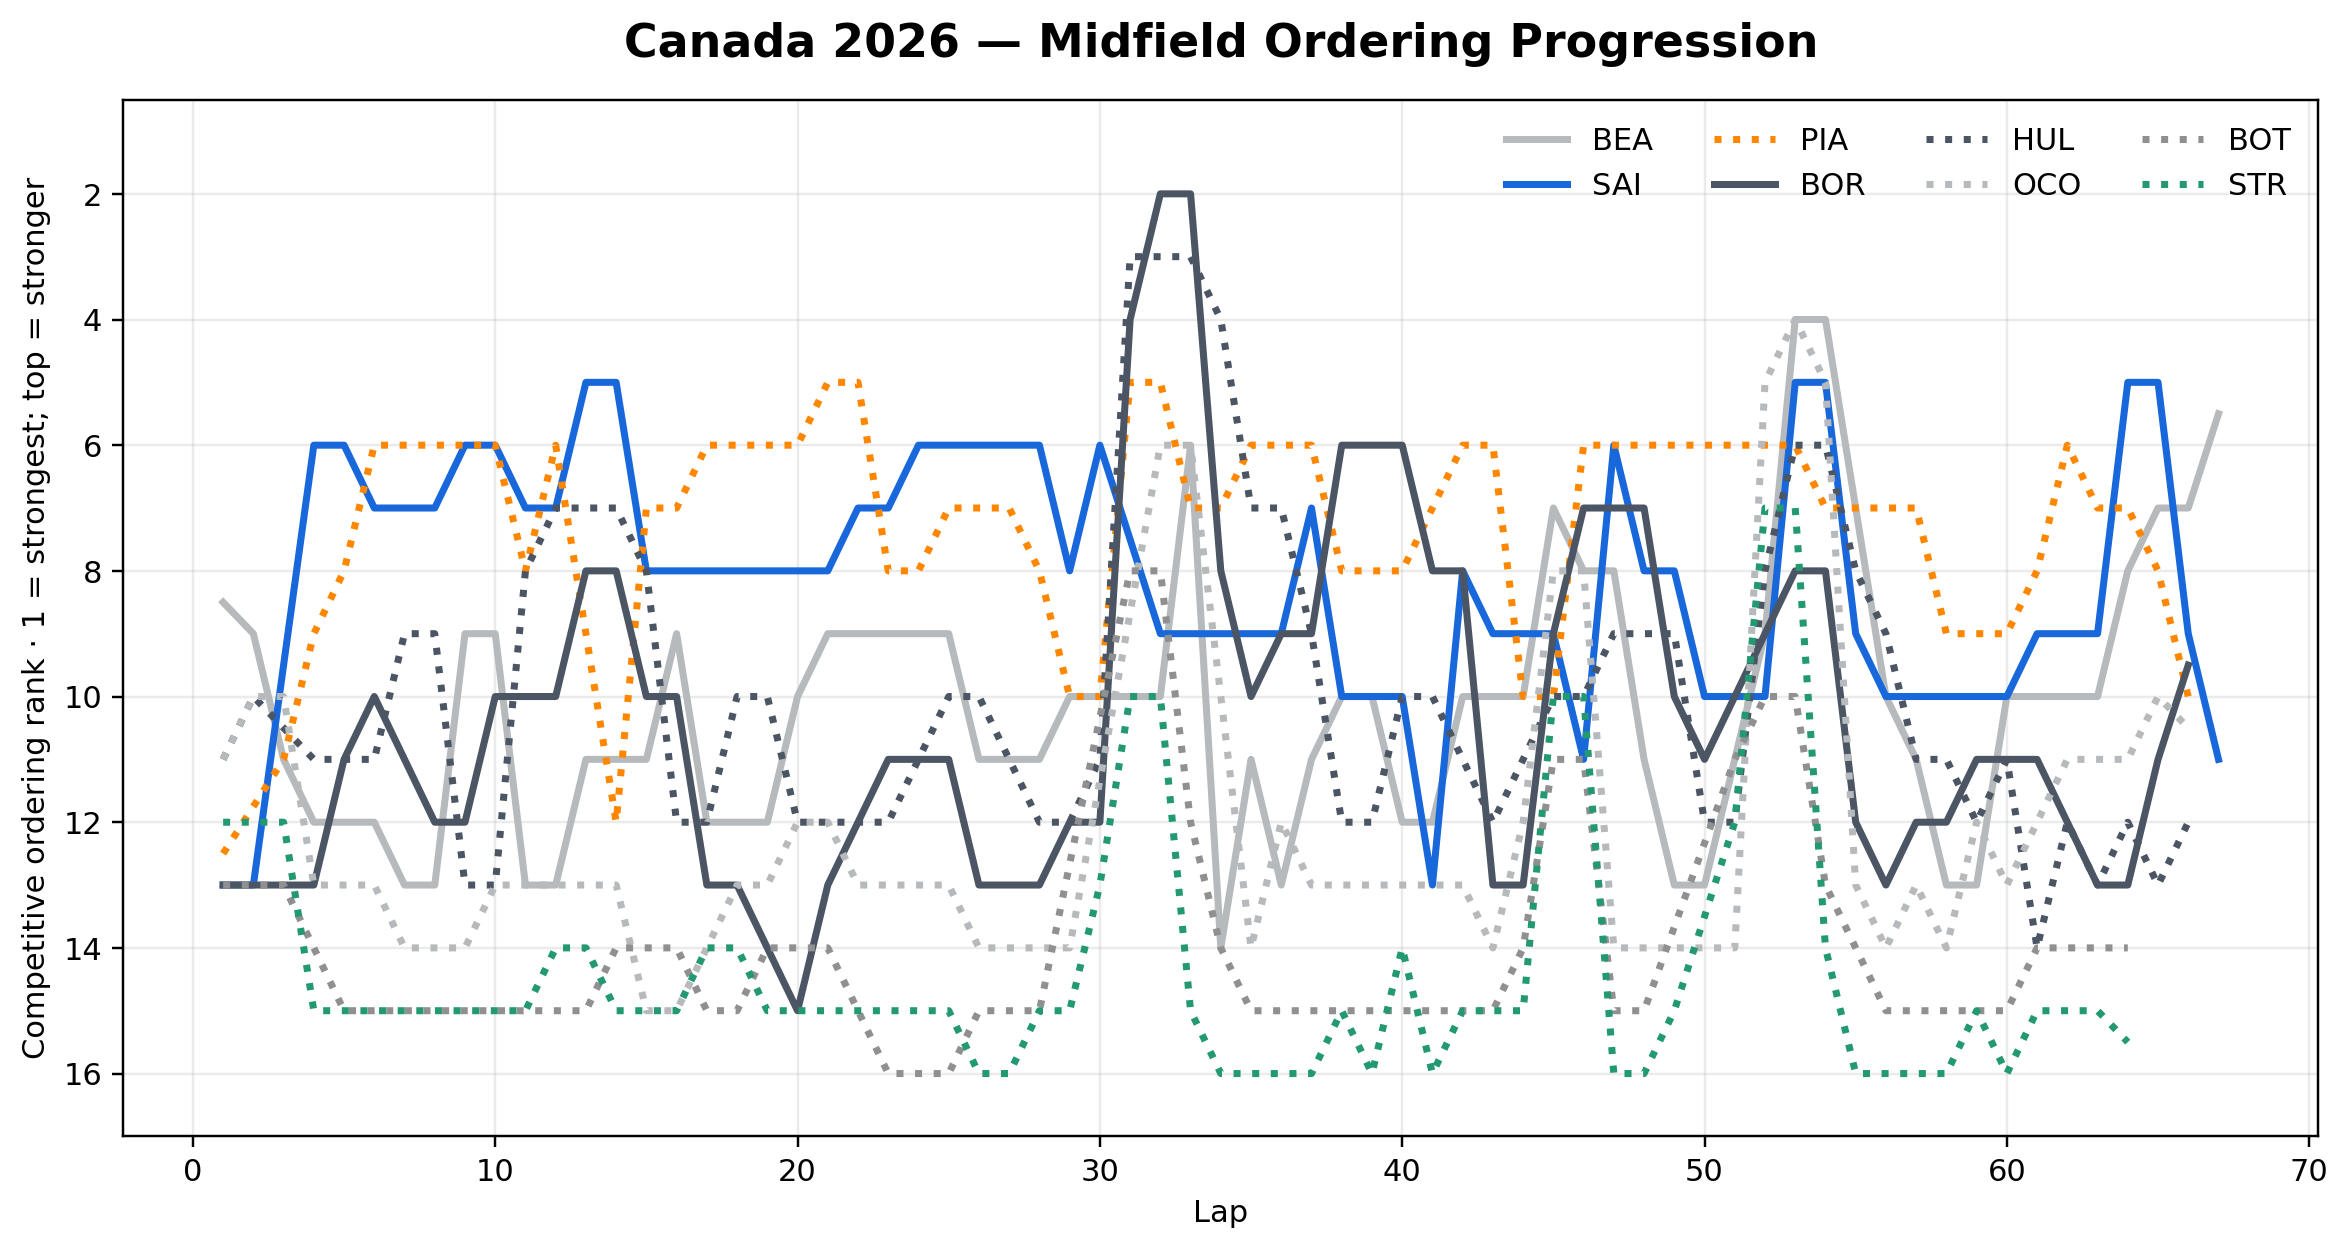
Competitive field and midfield
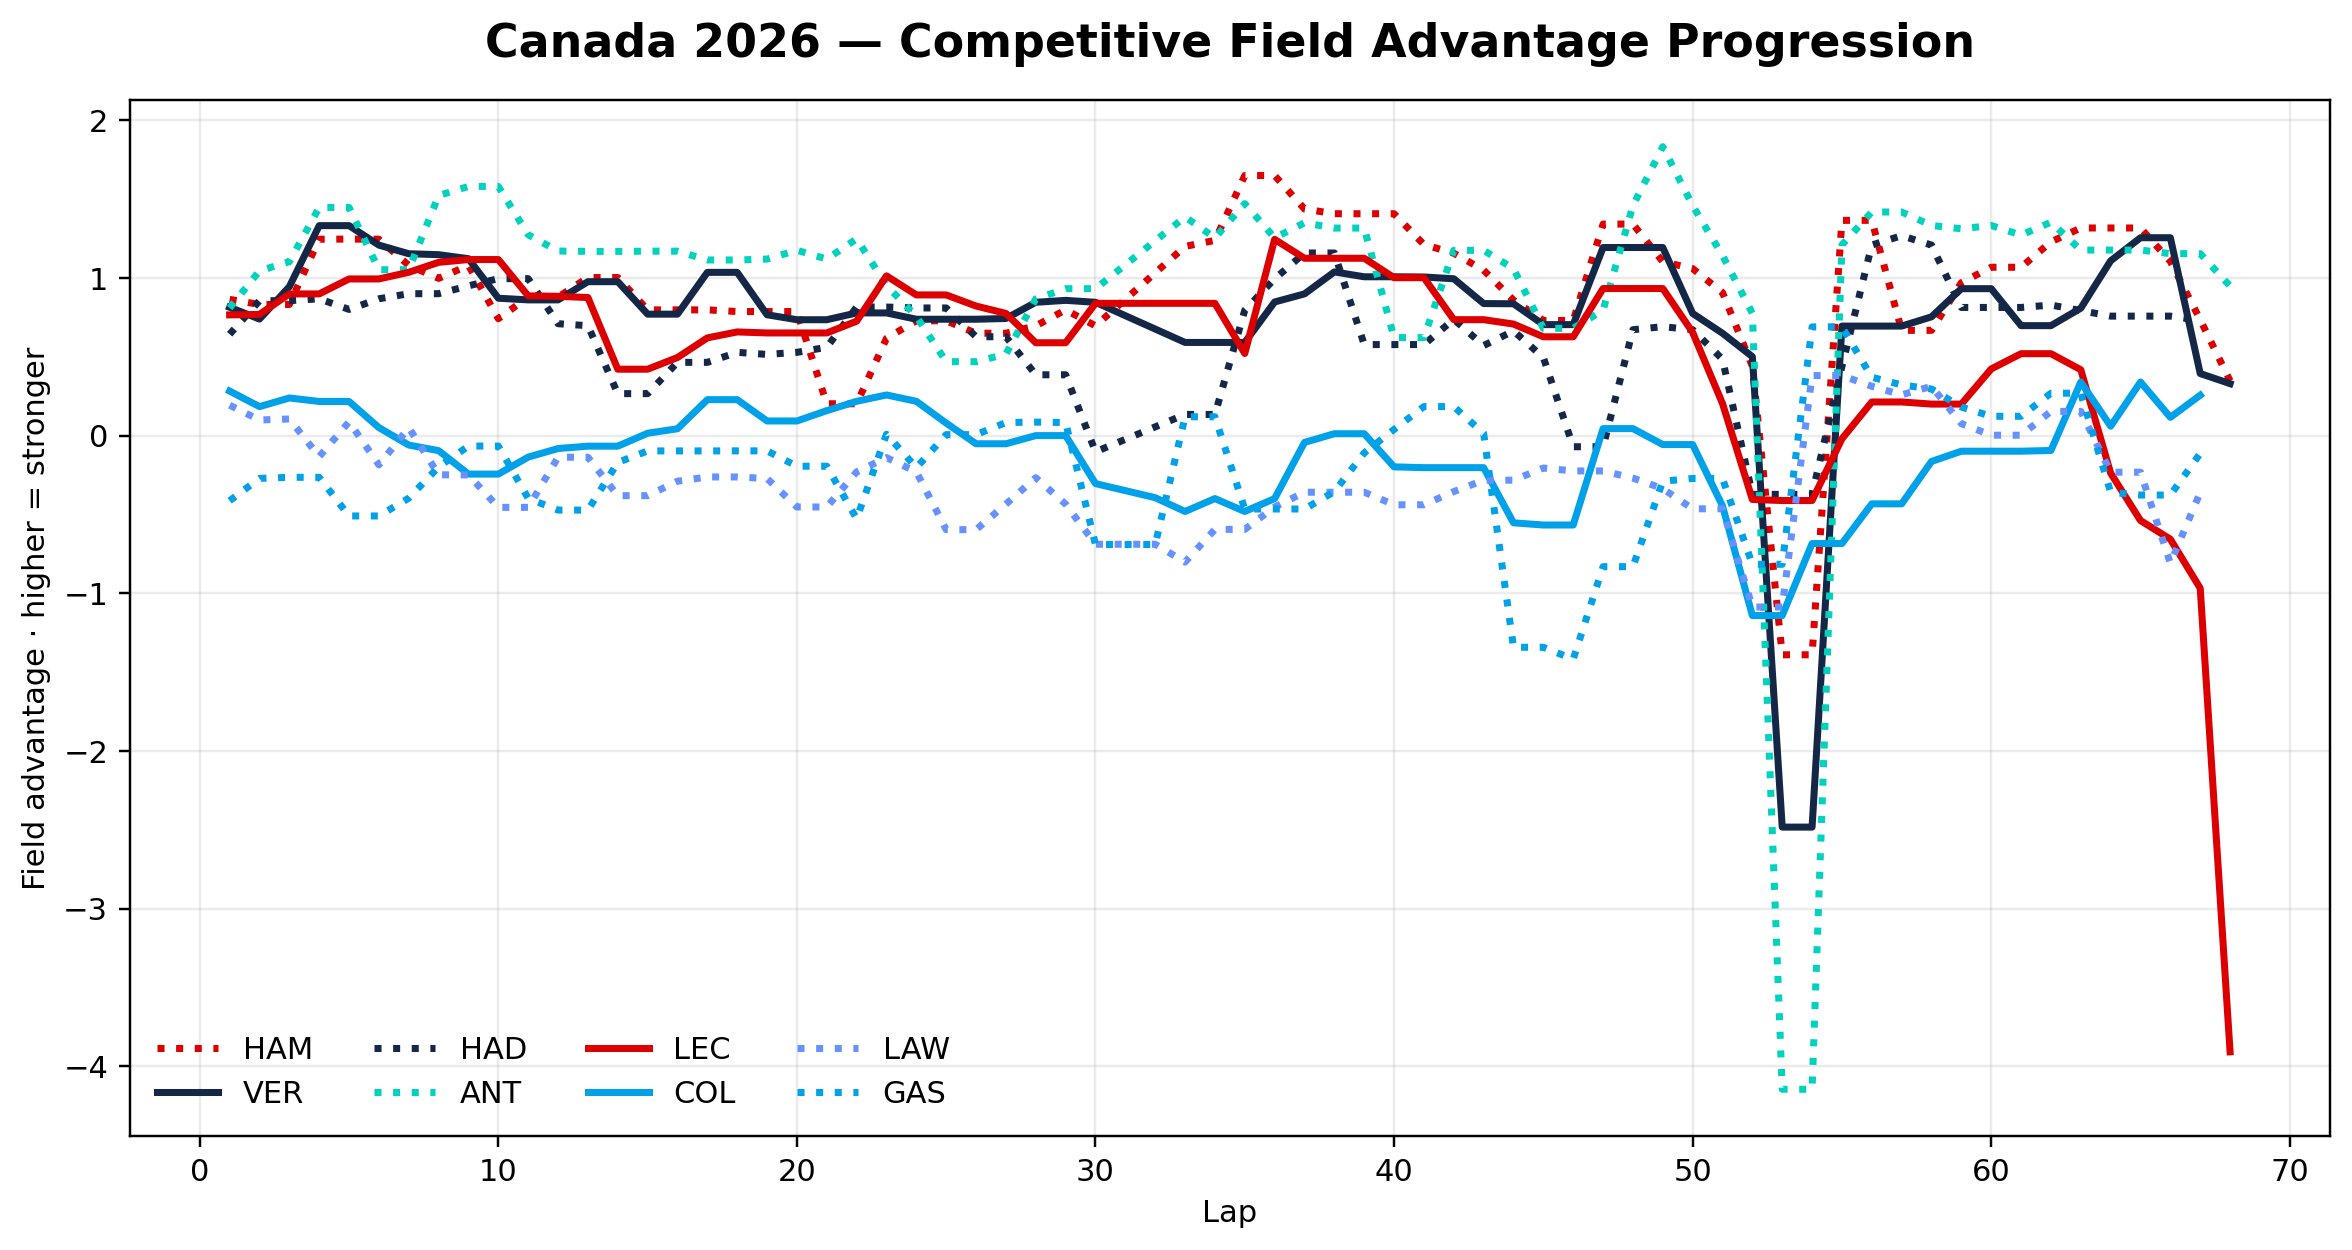
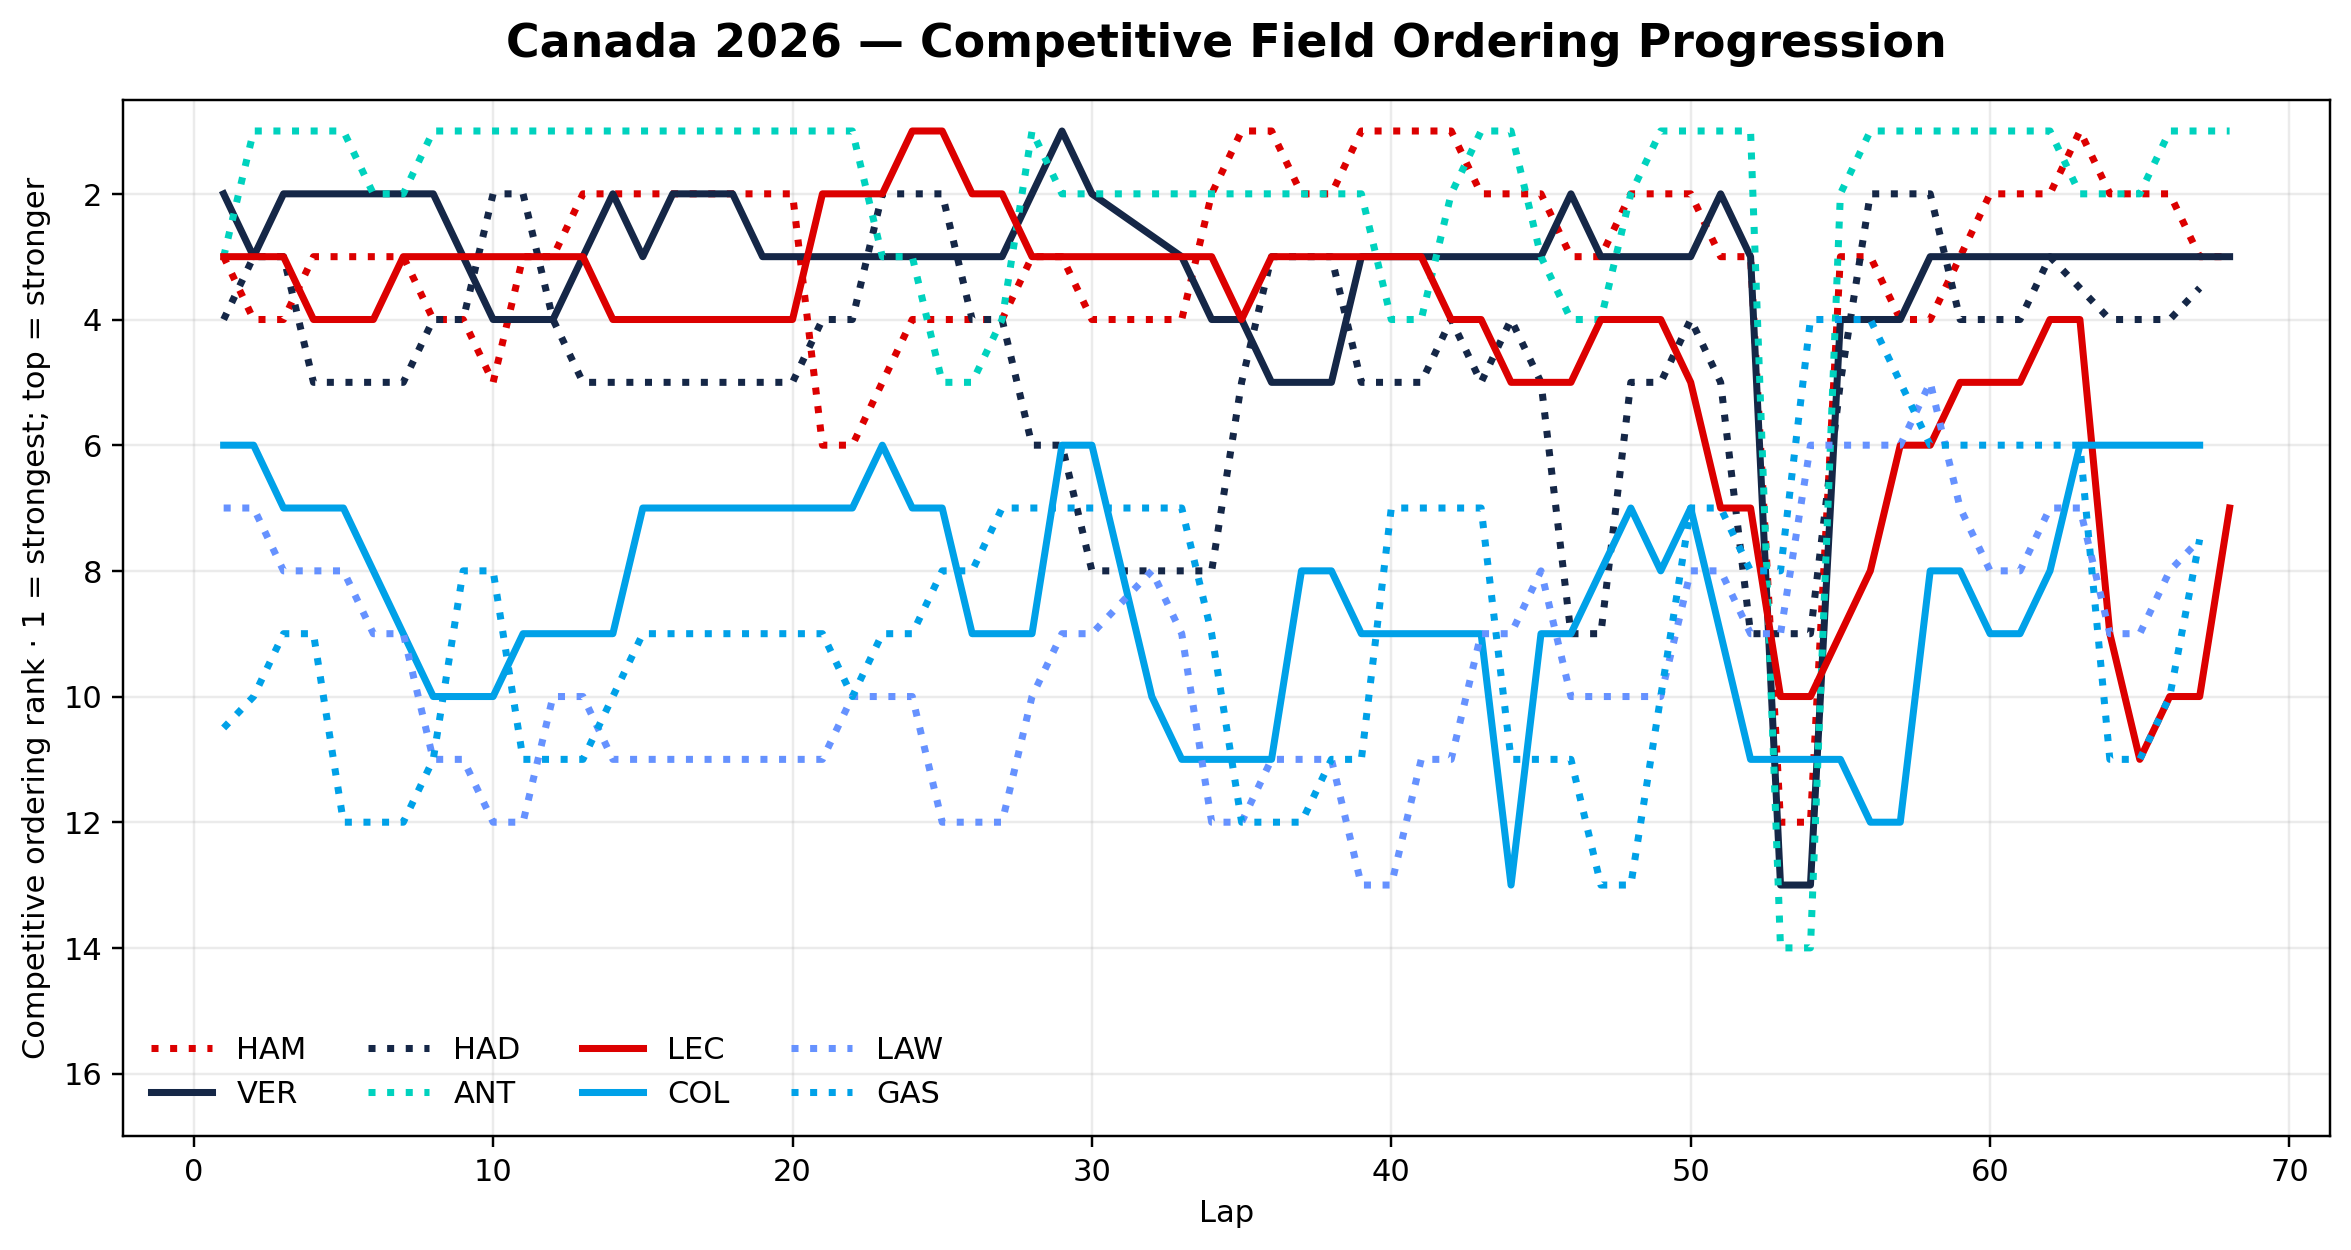
The group labels are event layers only. They are not permanent driver-quality categories.
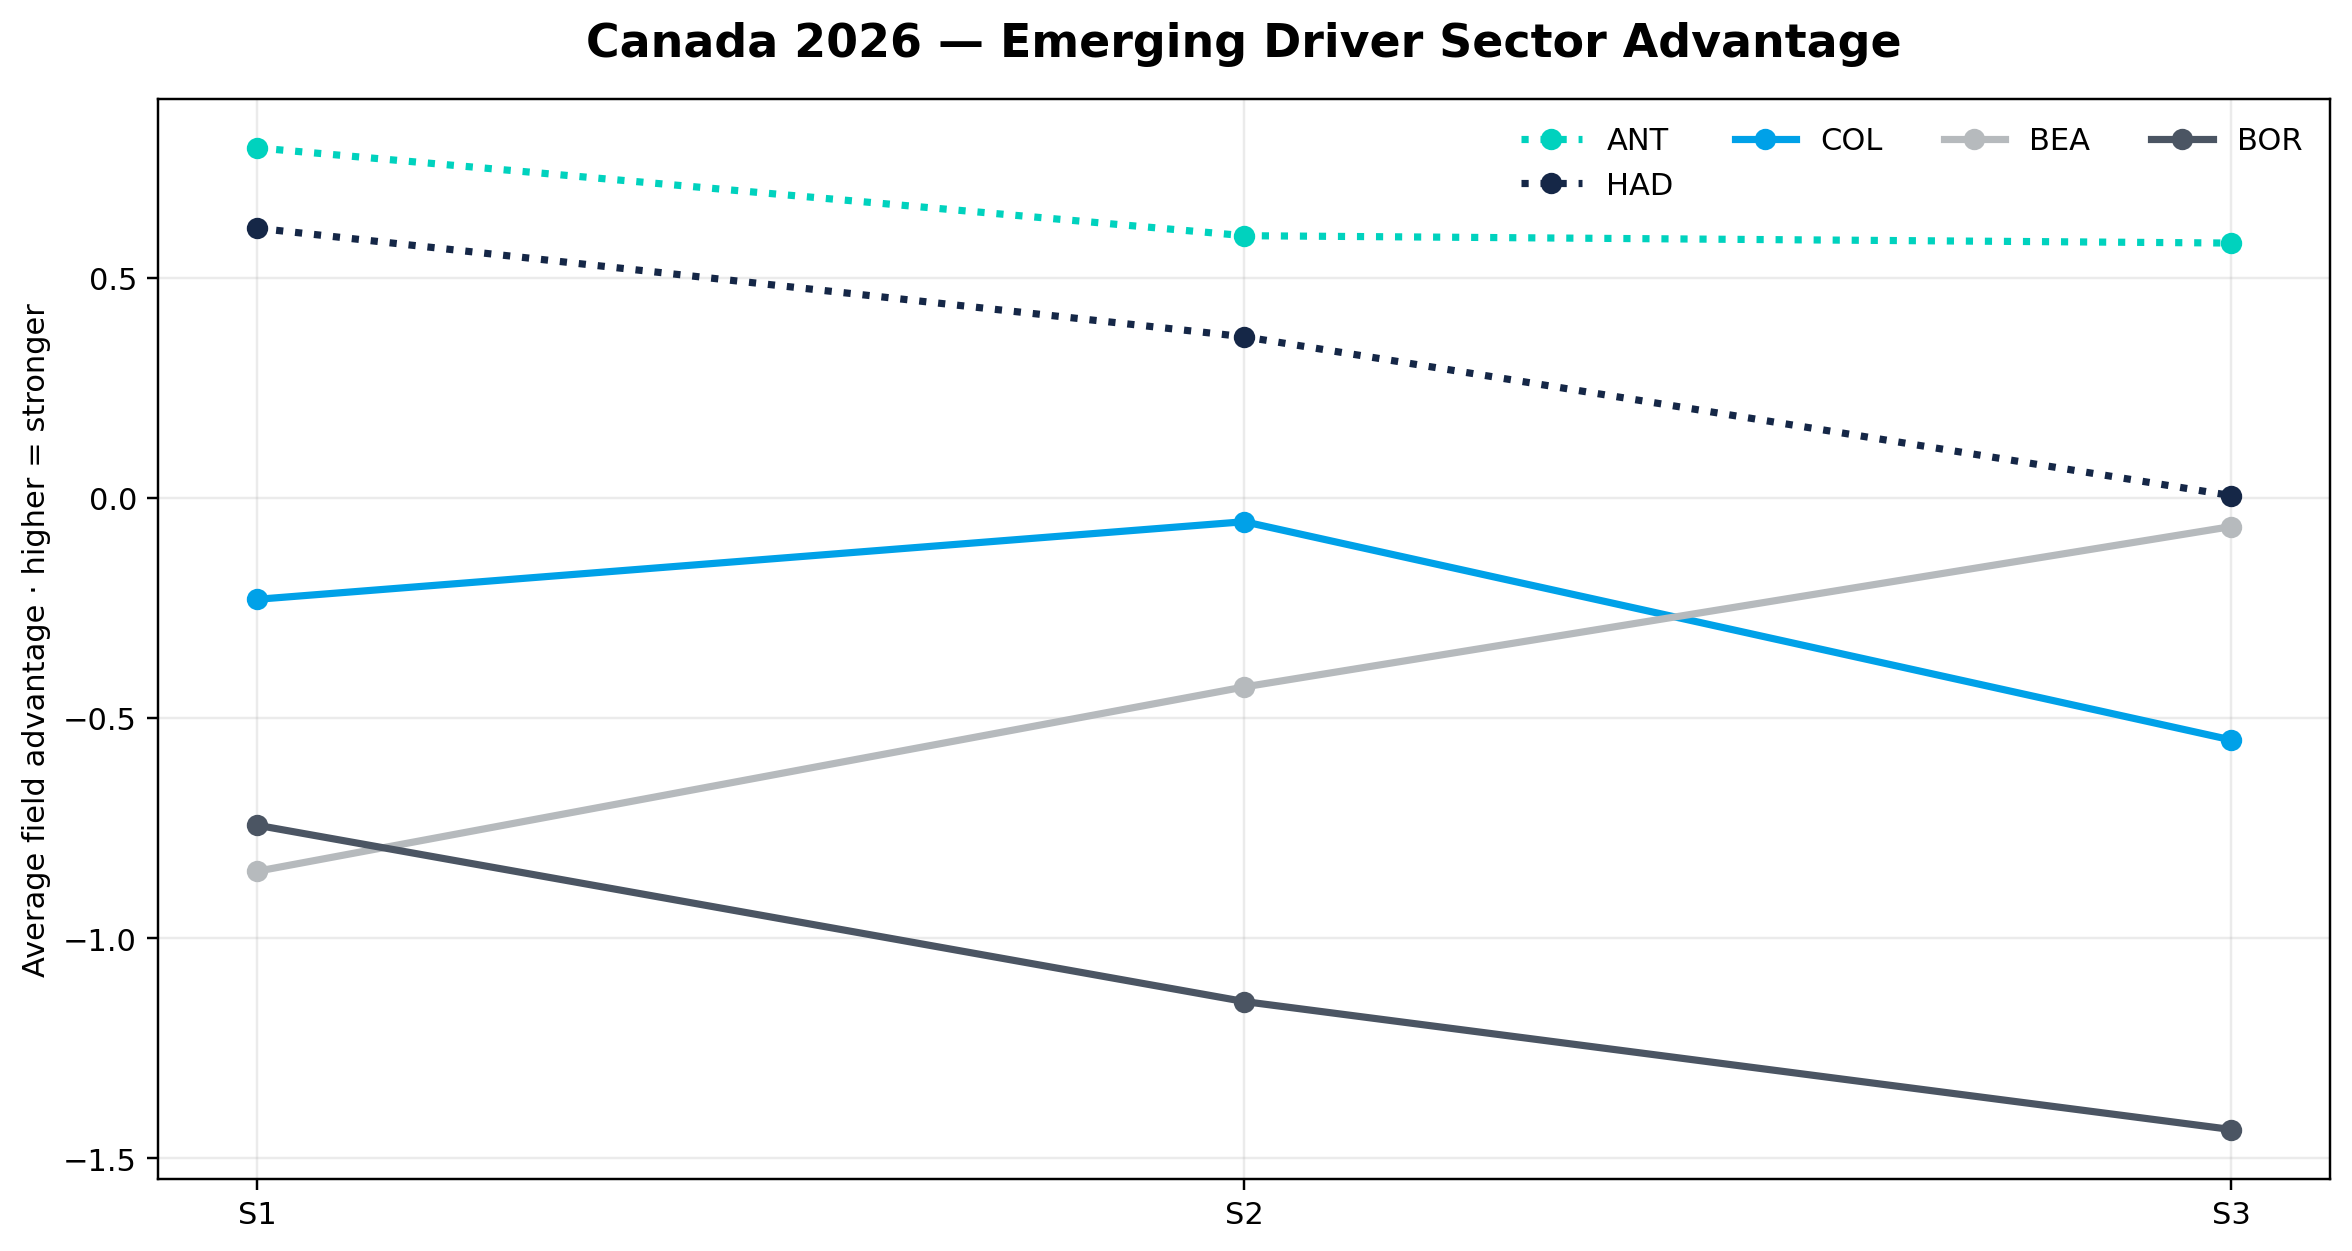
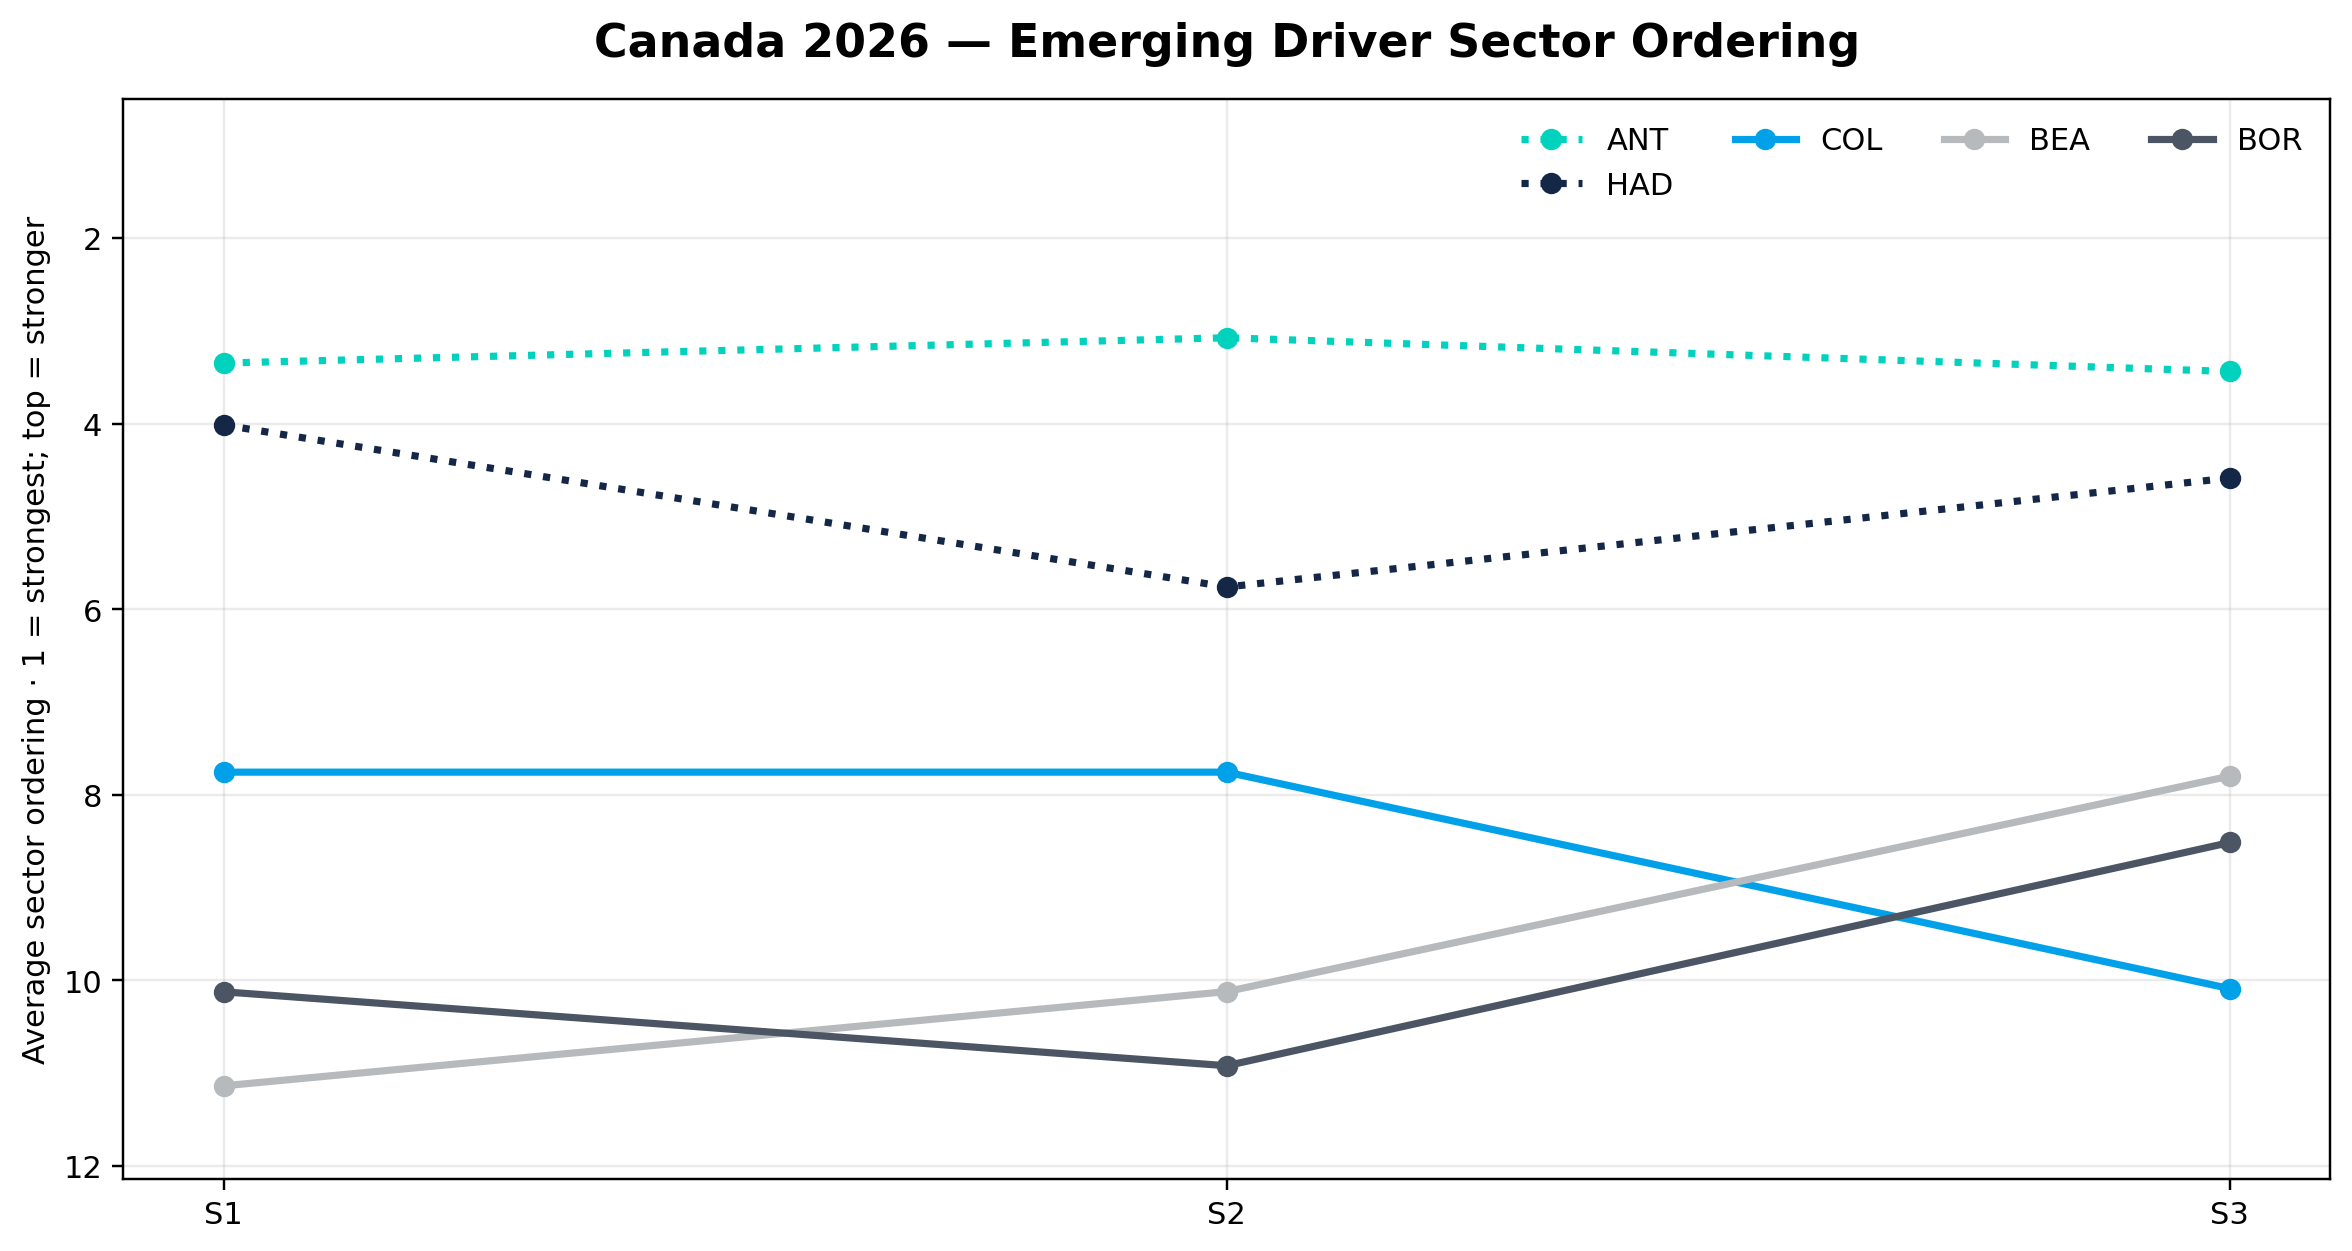
Emerging driver structure
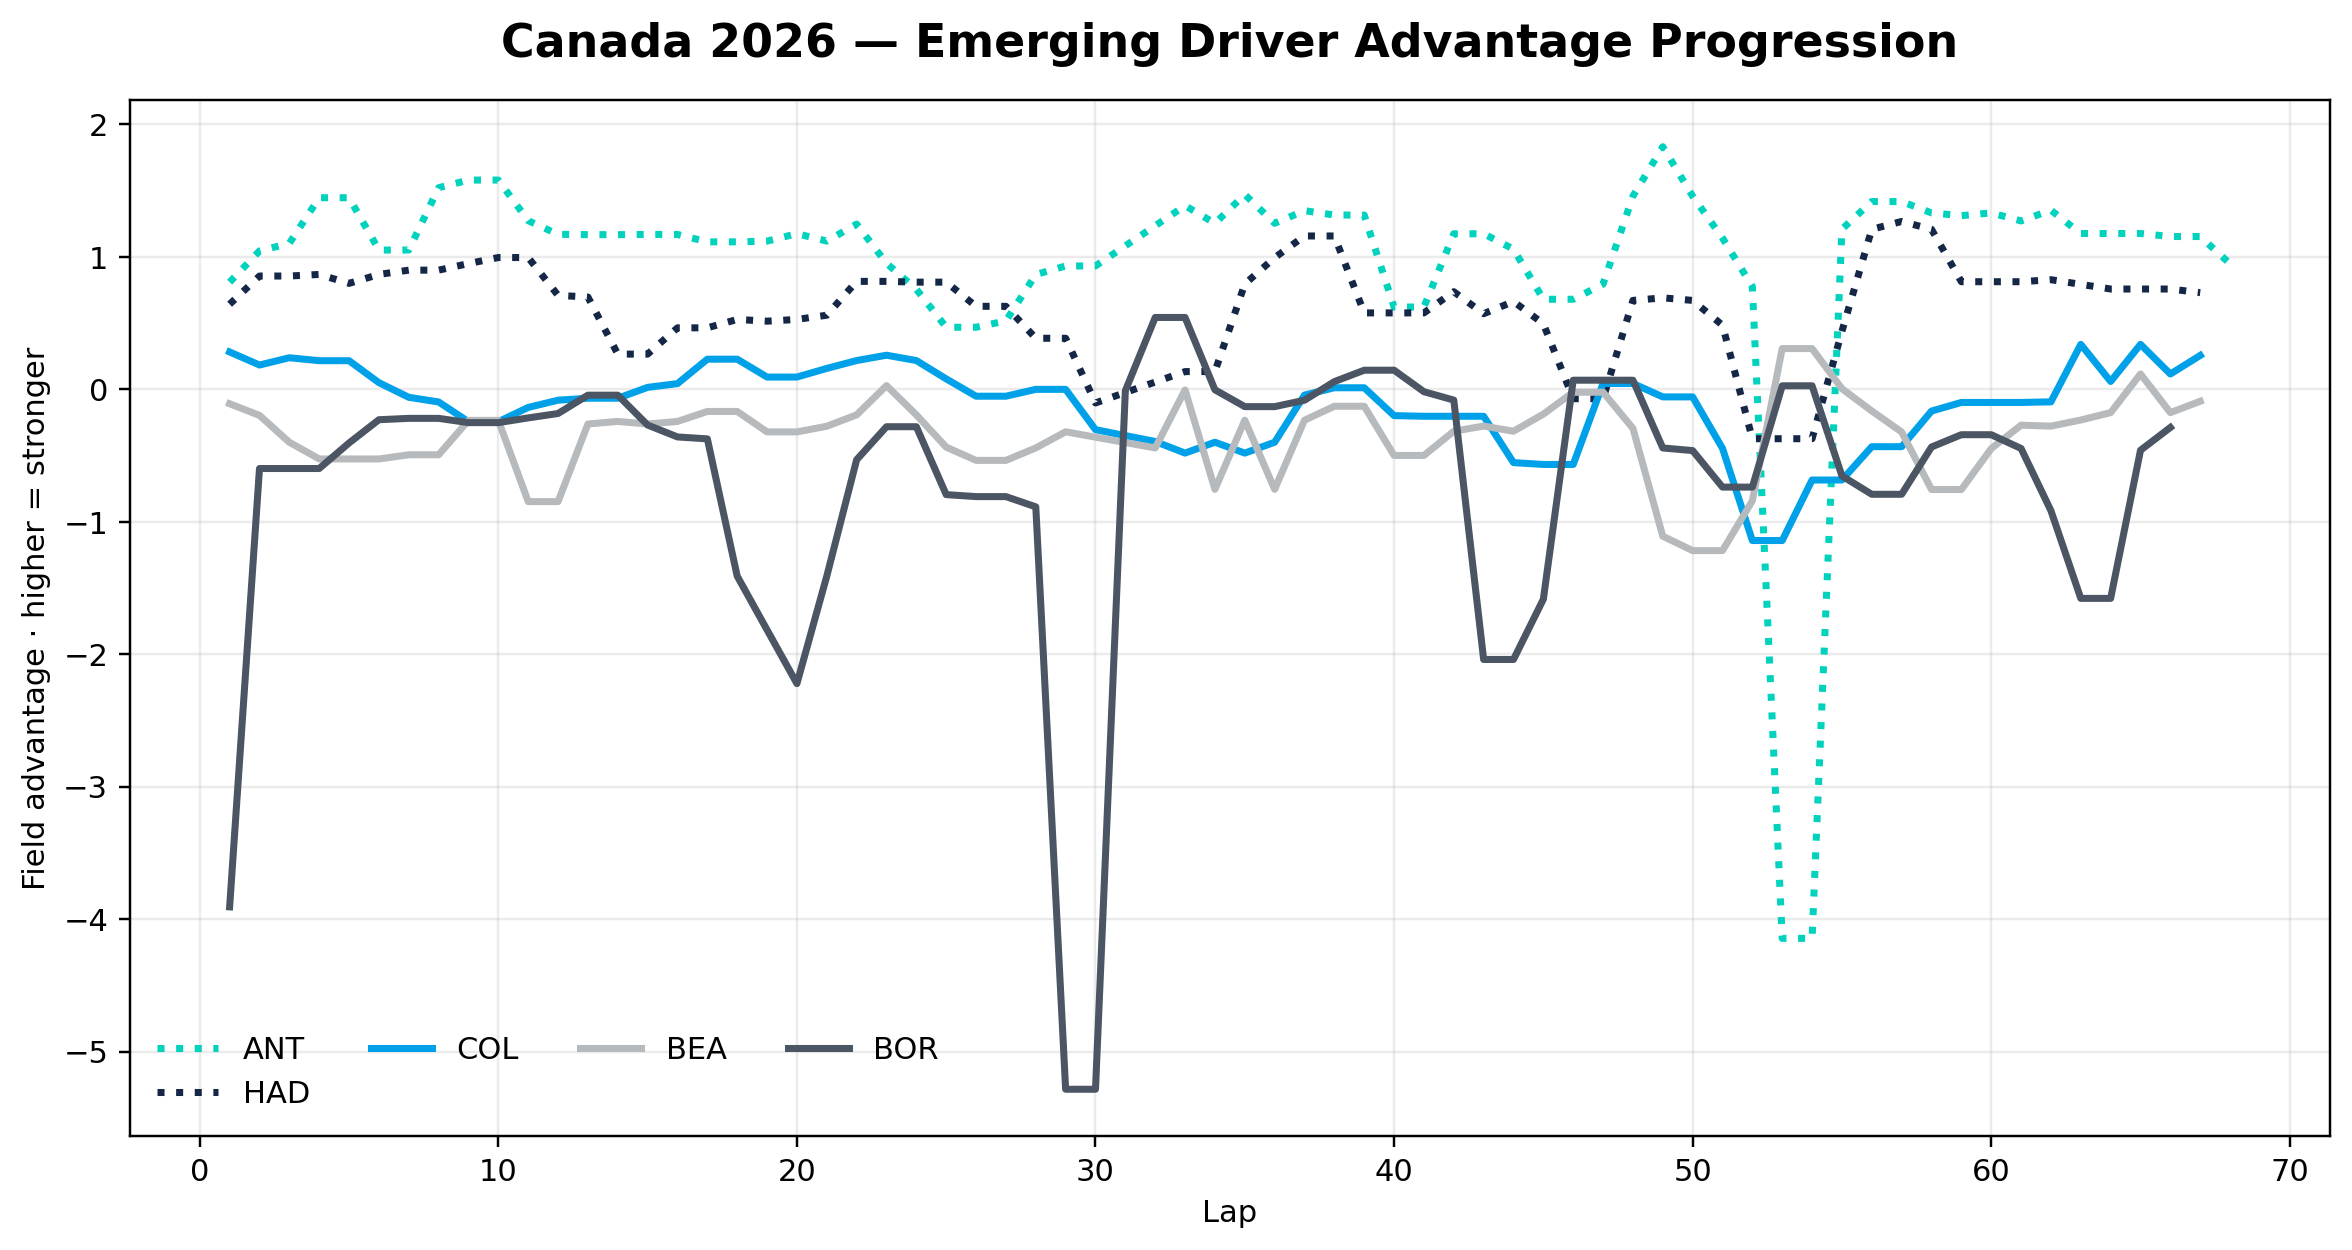
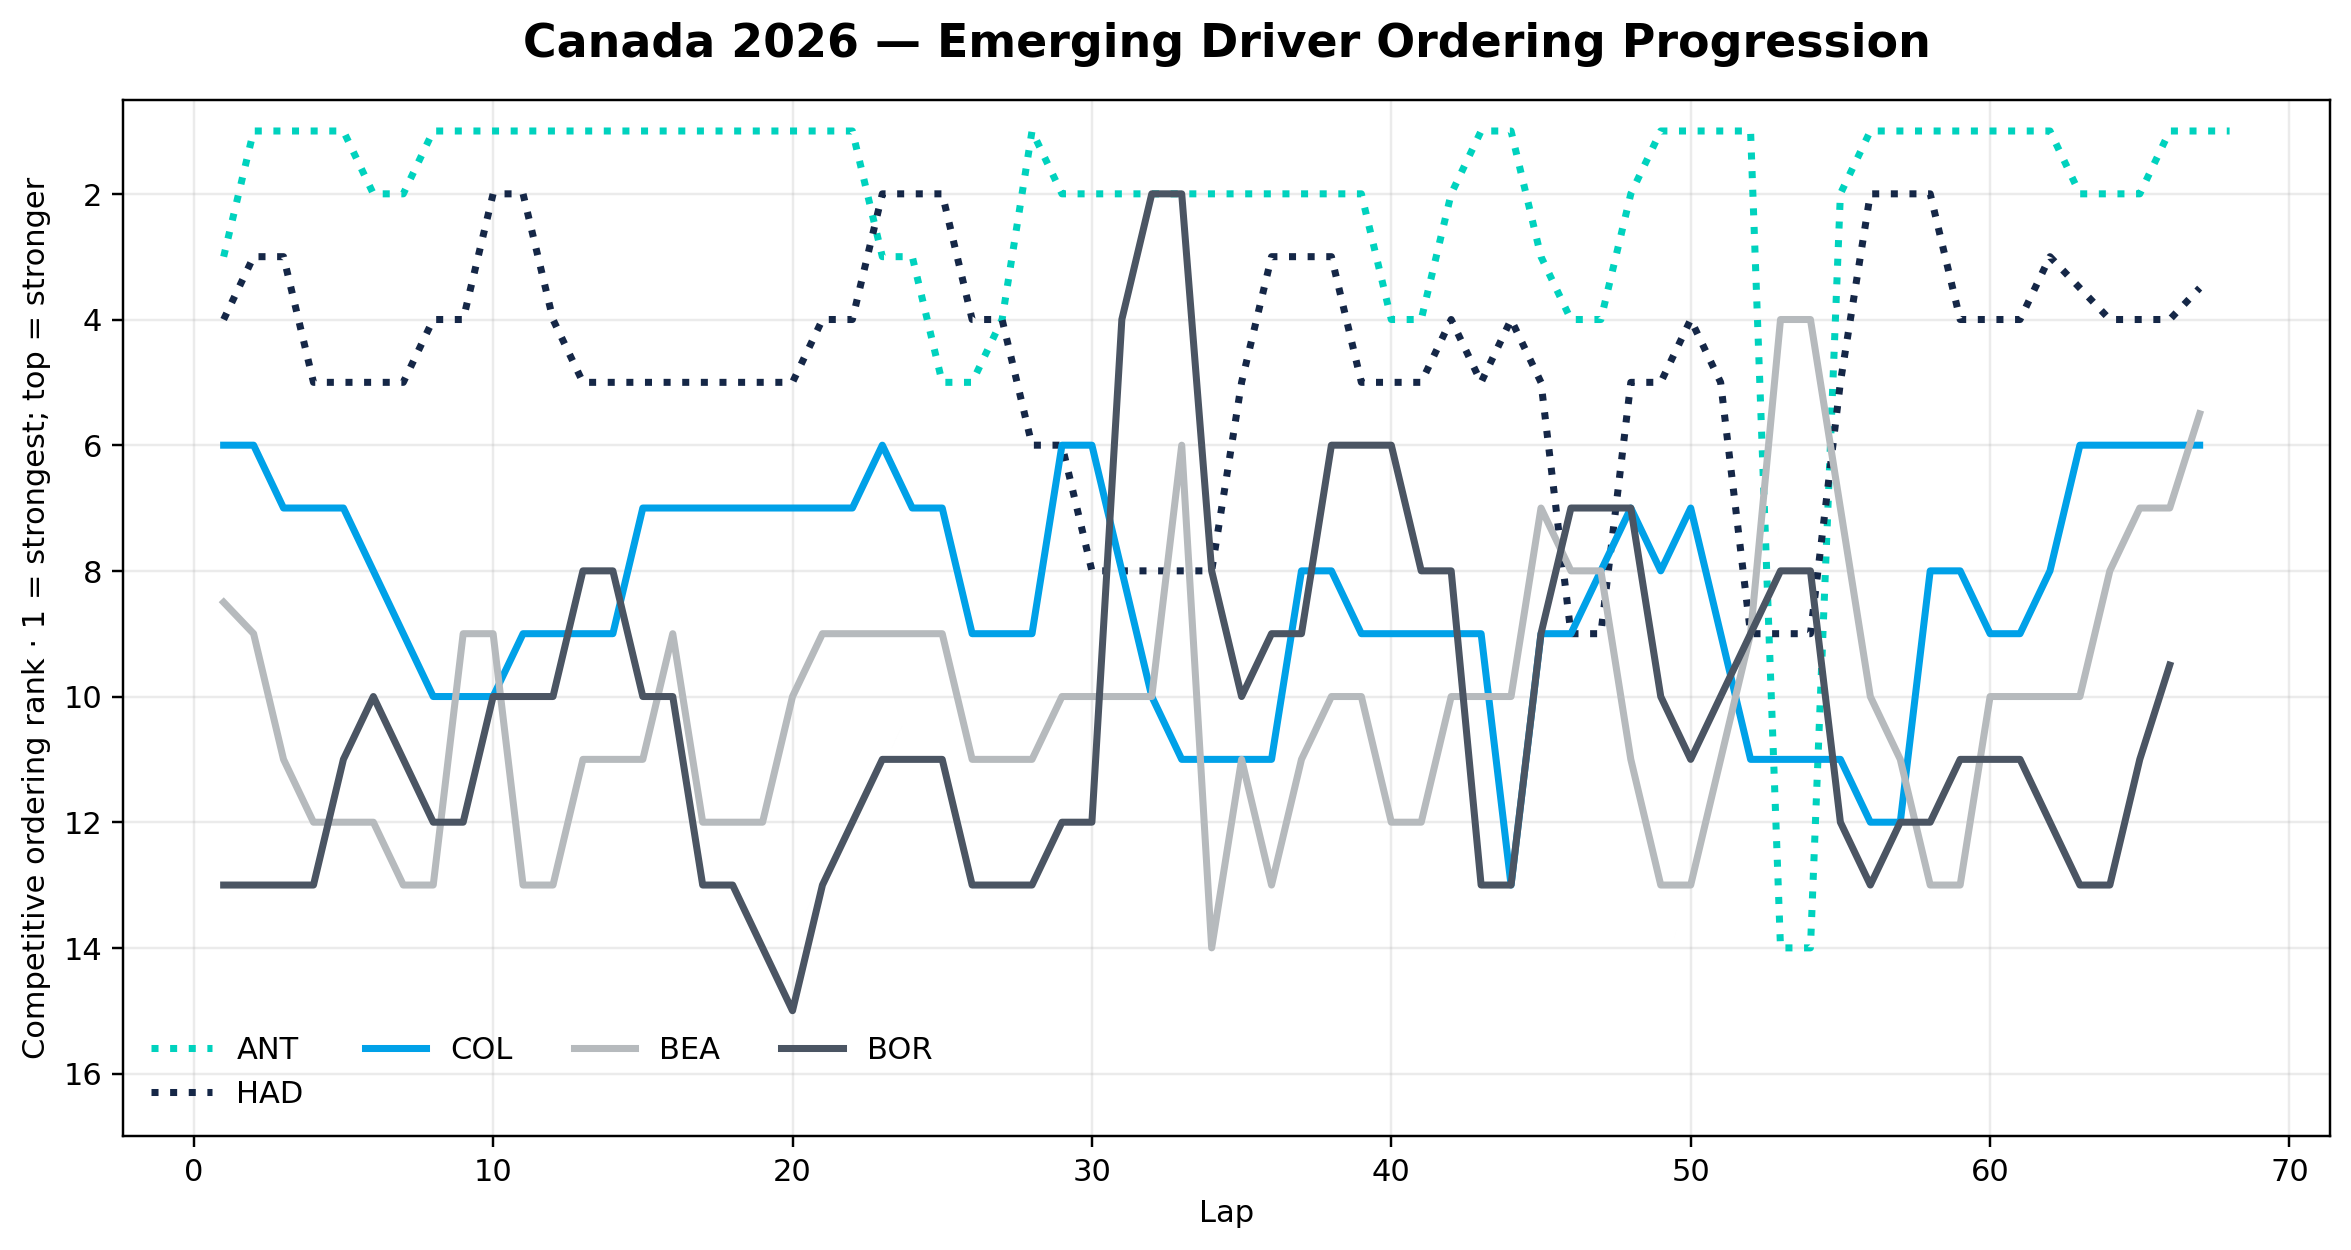
Hadjar is closing the gap to Antonelli, but Canada does not prove he has overtaken him structurally.
Battle windows
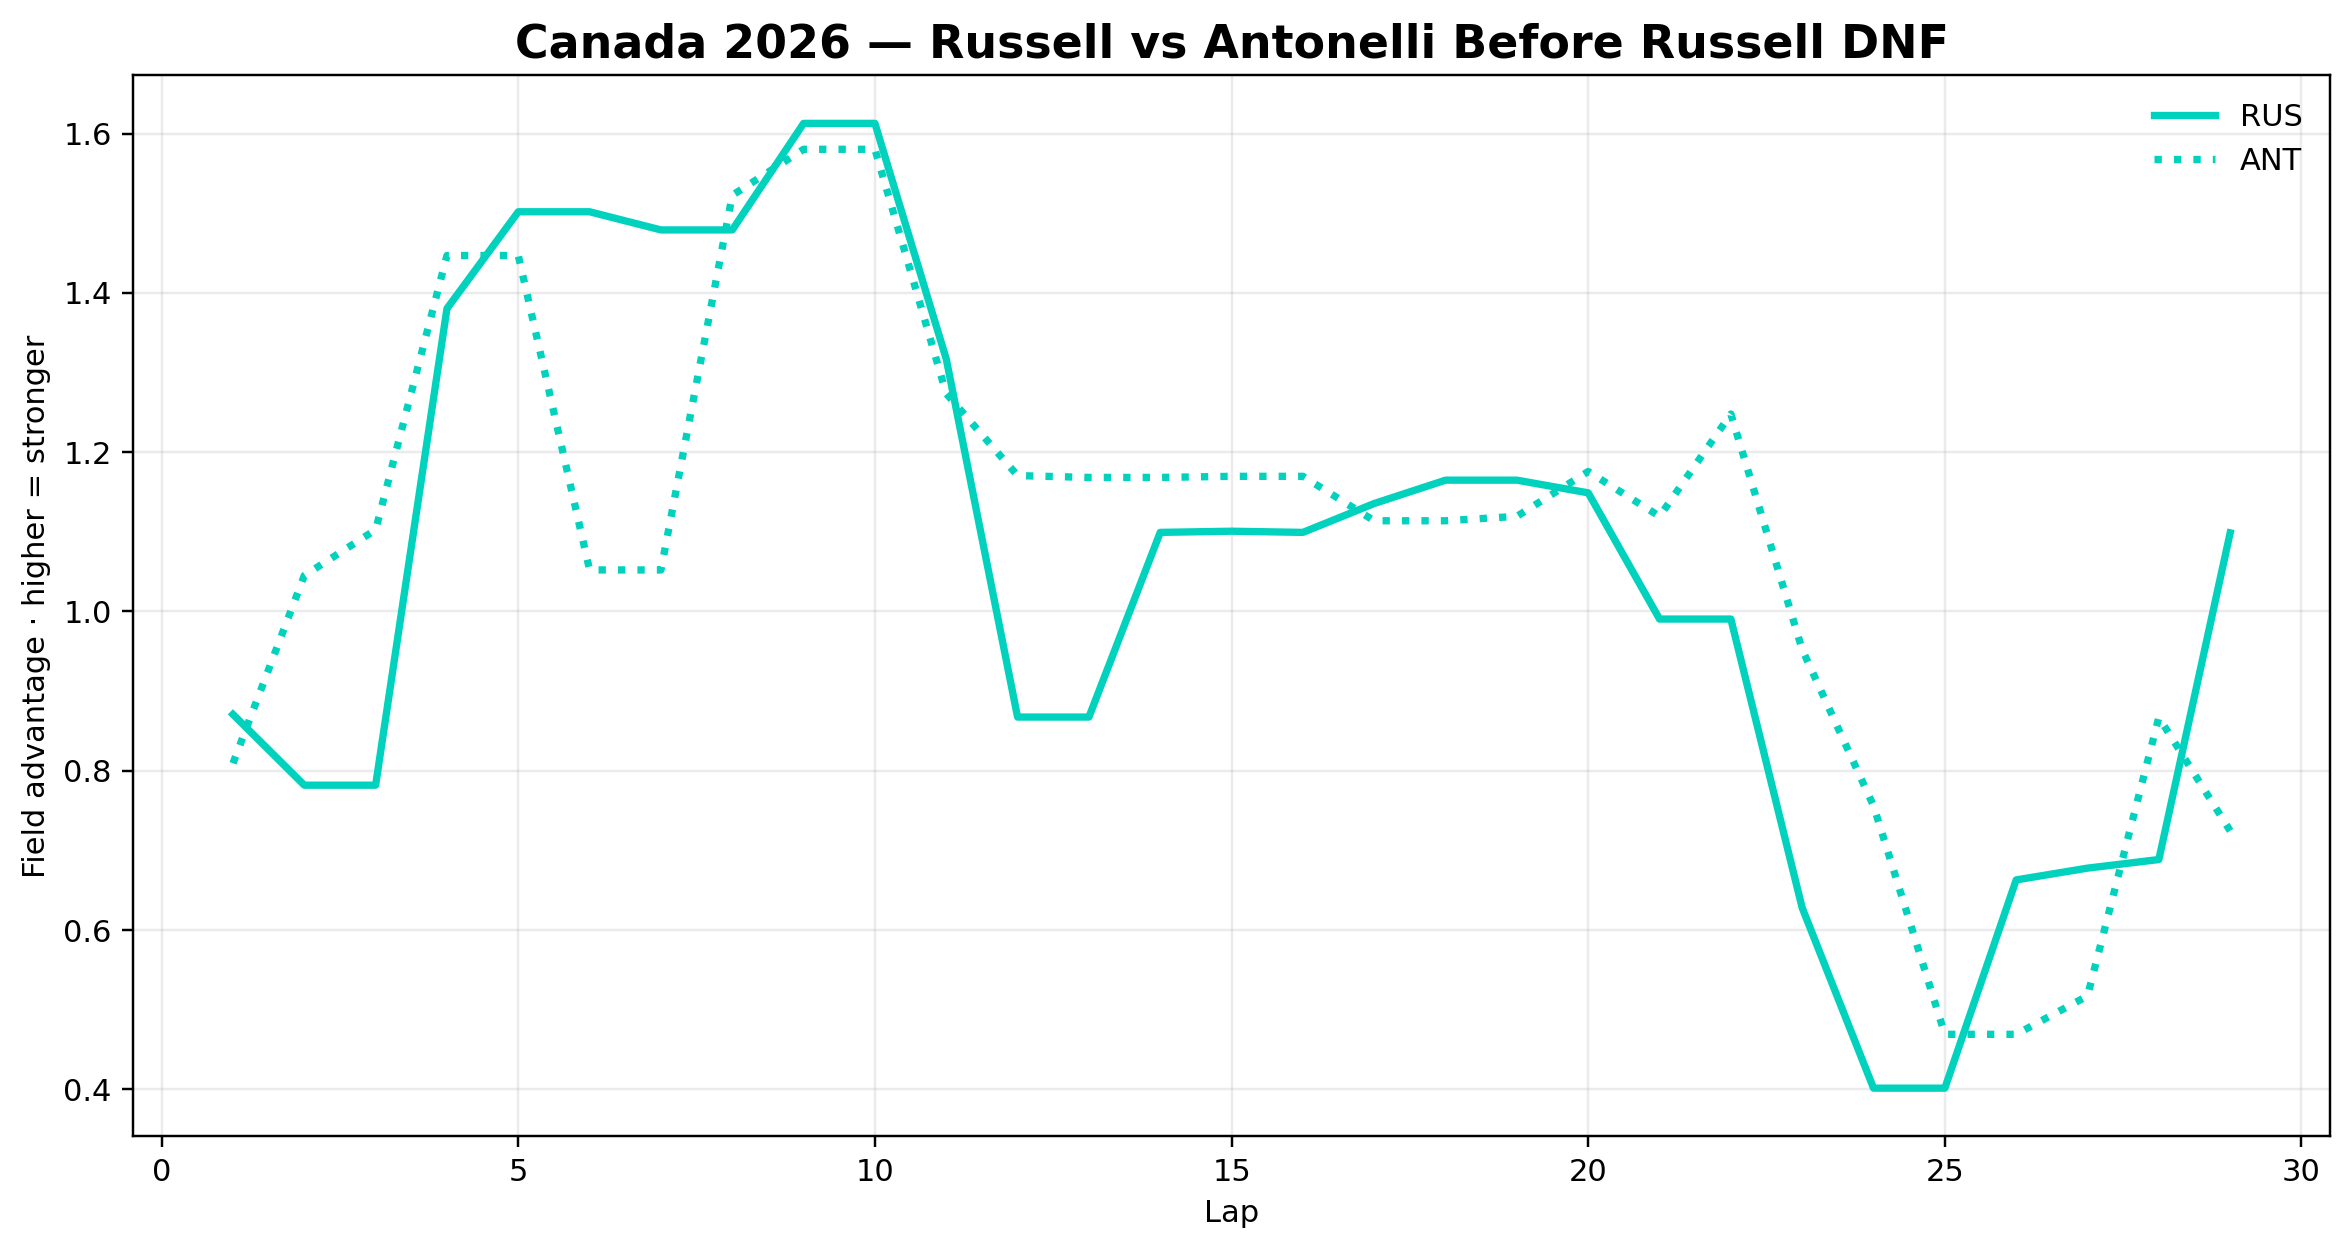
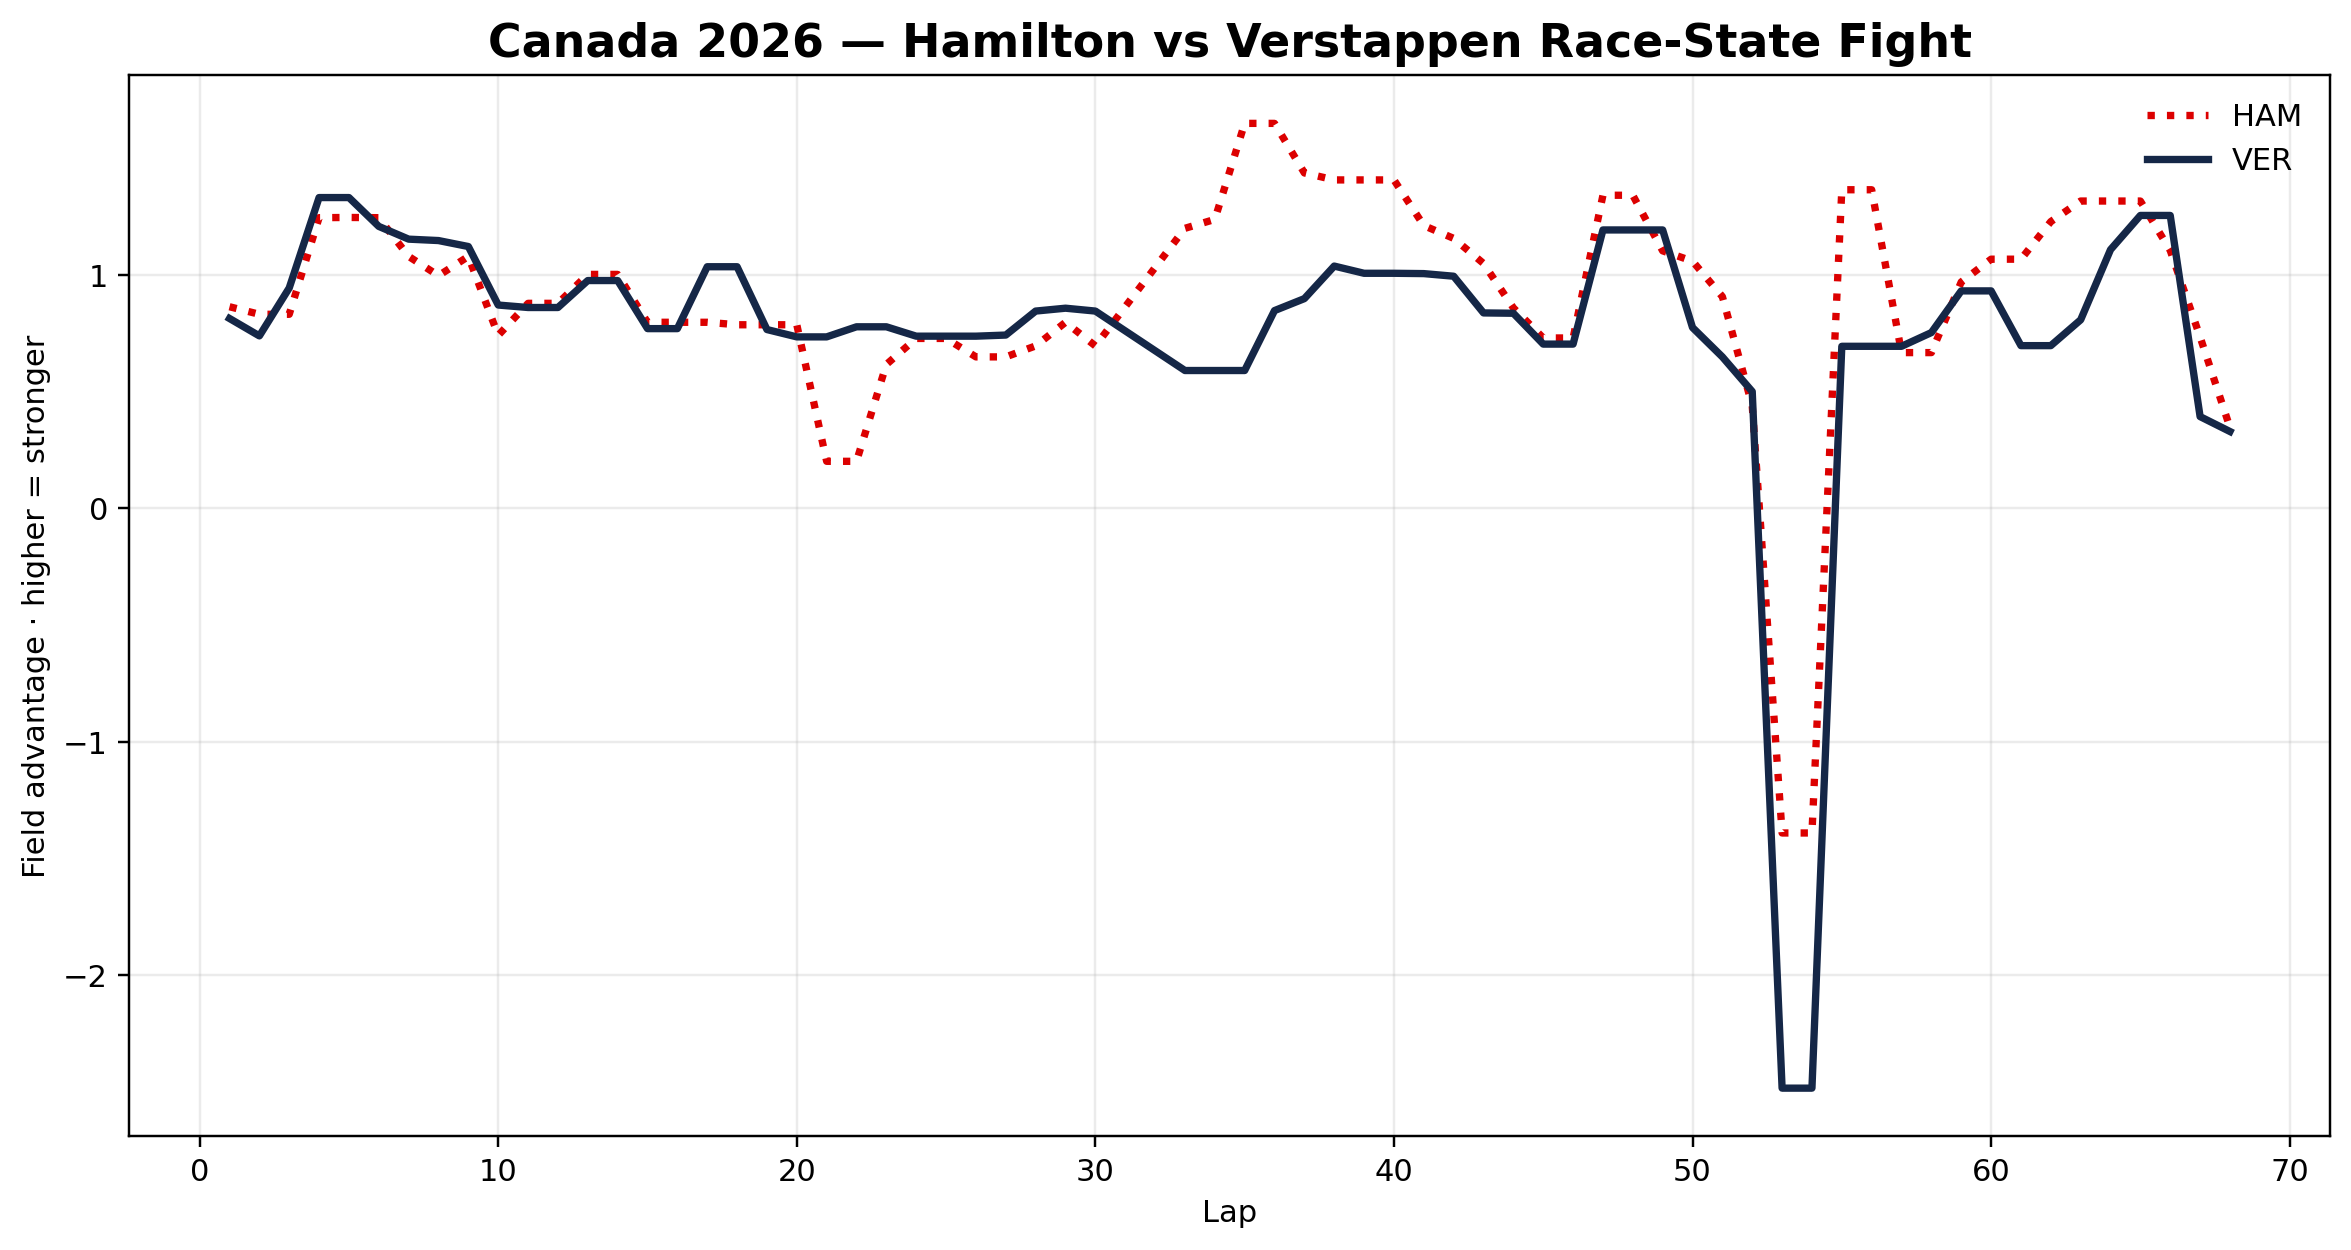
Canada has two battle graphs worth isolating.
Team-pair structure
Only Ferrari and Red Bull are shown as full two-driver pair cases. Mercedes and McLaren are excluded from this section because Russell and Norris did not complete enough of the race for clean full-pair comparison.